Project 1: Heart Disease Detection
Machine Learning is used across numerous spheres around the world. The healthcare industry is no exception. Machine Learning can play an essential part in predicting presence/ absence of Locomotor diseases, Heart conditions and further. similar information, if predicted well in advance, can give important perceptivity to doctors who can also adapt their opinion and treatment per case base.
In this part, we will discuss a project where we will be working on predicting potential Heart Diseases in people using Machine Learning algorithms. The algorithms used in this project is Logistic Regression. The dataset can be found here.
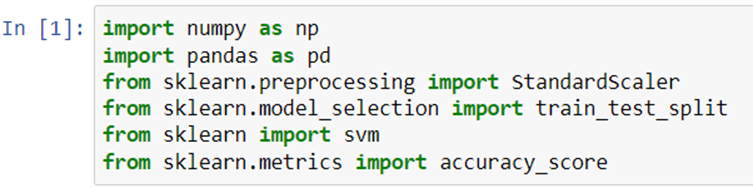
Step 1: Firstly, we will import the necessary libraries for this project.
- numpy: To work with array.
- pandas: To work with csv files and dataframes.
- matplotlib: To create charts using pyplot.
- train_test_split: To split the dataset into training and testing data
- StandardScaler: To scale all the features, so that the Machine Learning model better adapts to the dataset.

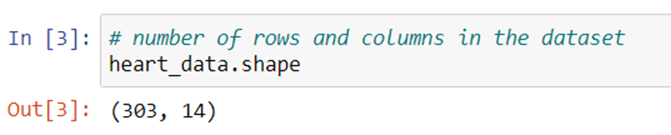
Step 2: we will be loading our data using pandas’s read_csv function and printing the top 5 rows with the help of head() function also we will check the shape of our dataset with shape() function.

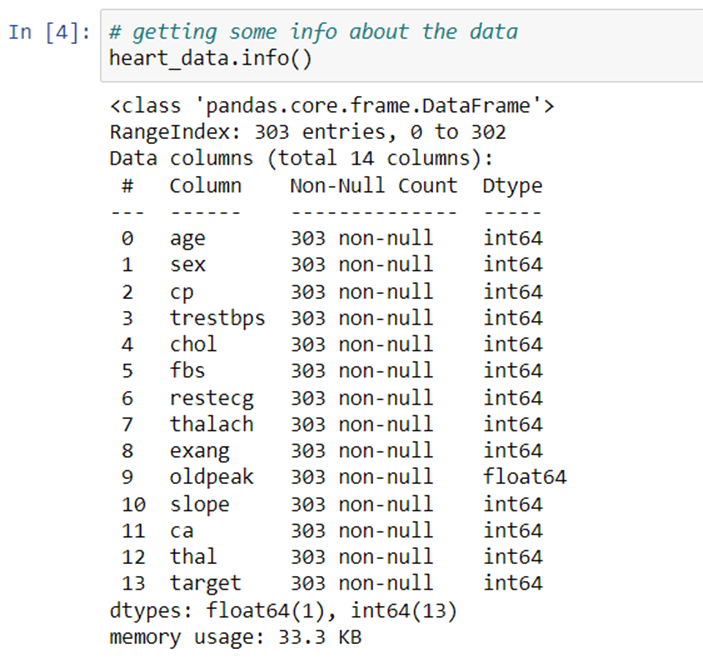
Step 3: Now we will be using info() function which prints information about a DataFrame including the index dtype and columns, non-null values and memory usage.
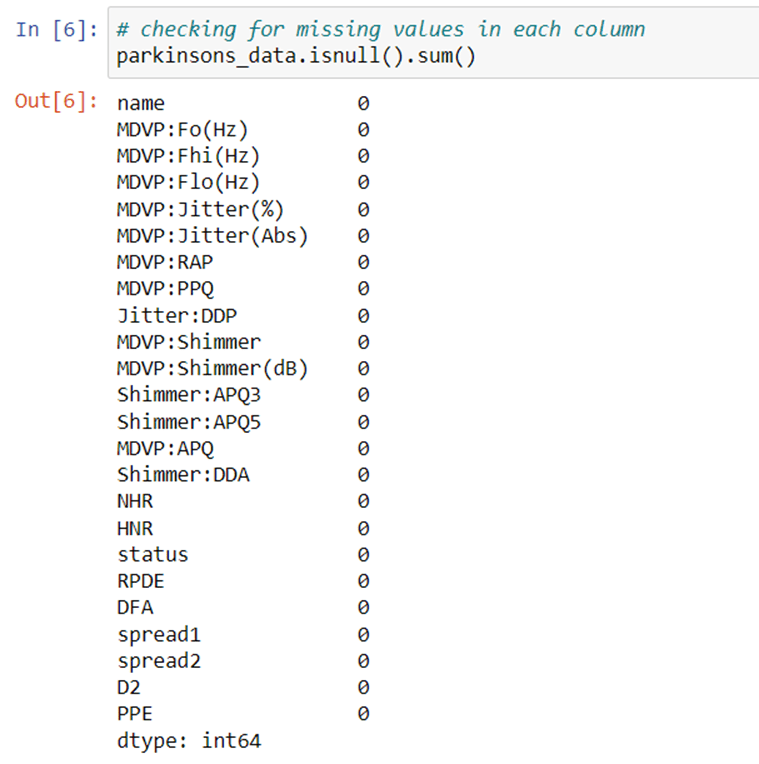
Step 4: We will check the Null values in our dataset with the help of isnull() function.

As we can that there is no null value in our dataset so now we can move forward with other steps.
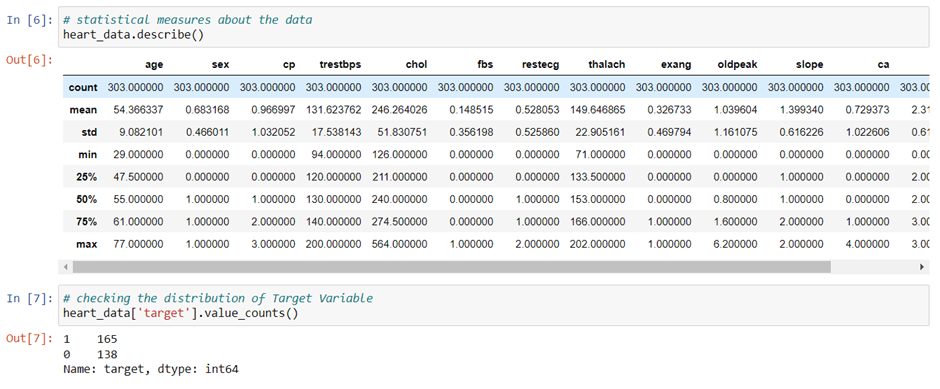
Step 5: let’s look into the description of the data with the describe() method and also distribution of our dataset.
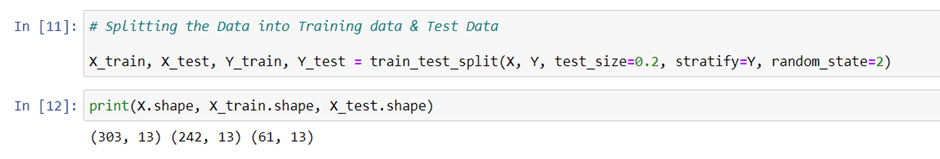
Step 6: now we will separate our data.
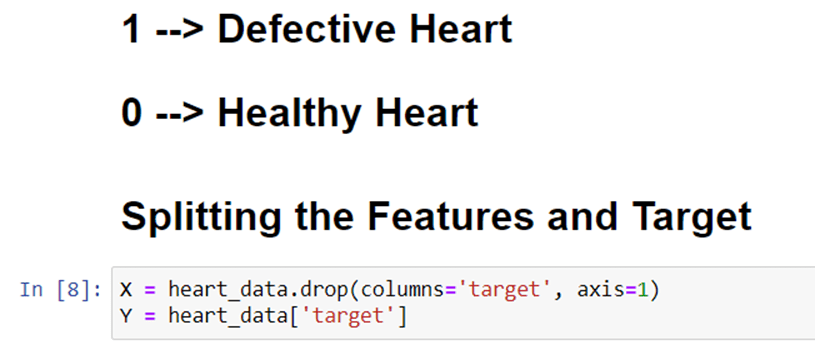
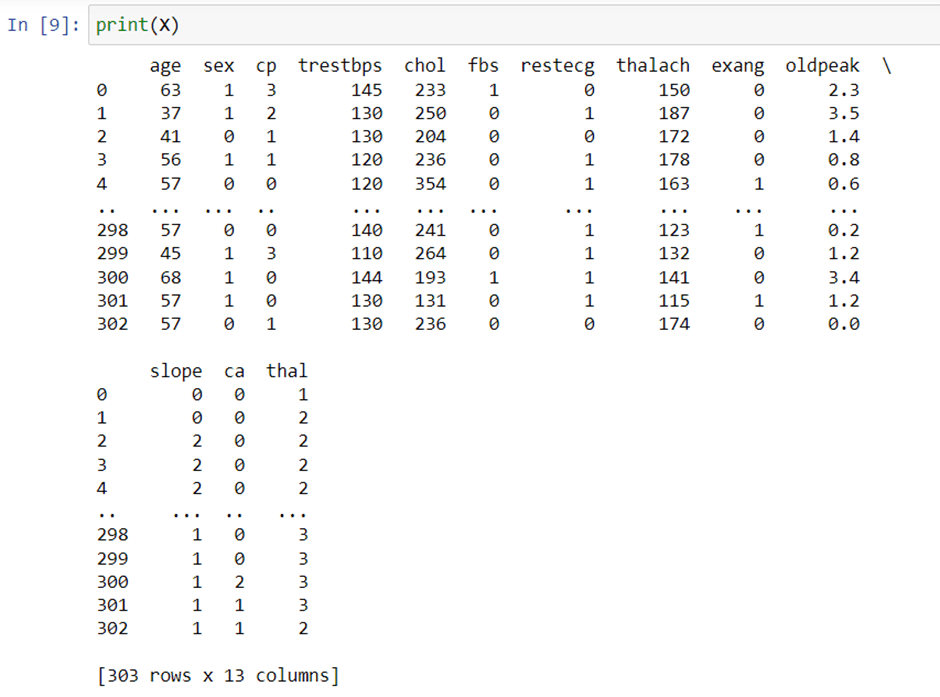
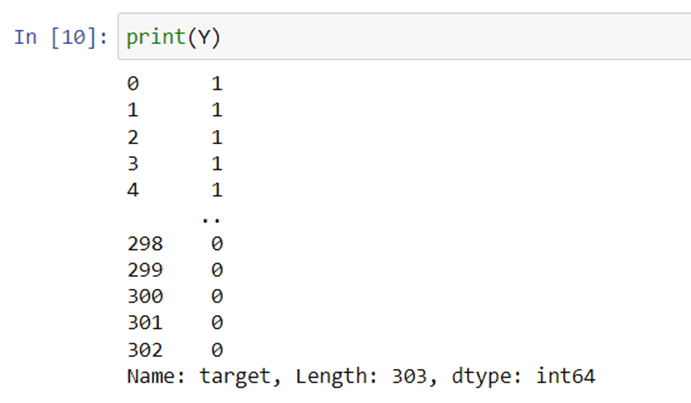
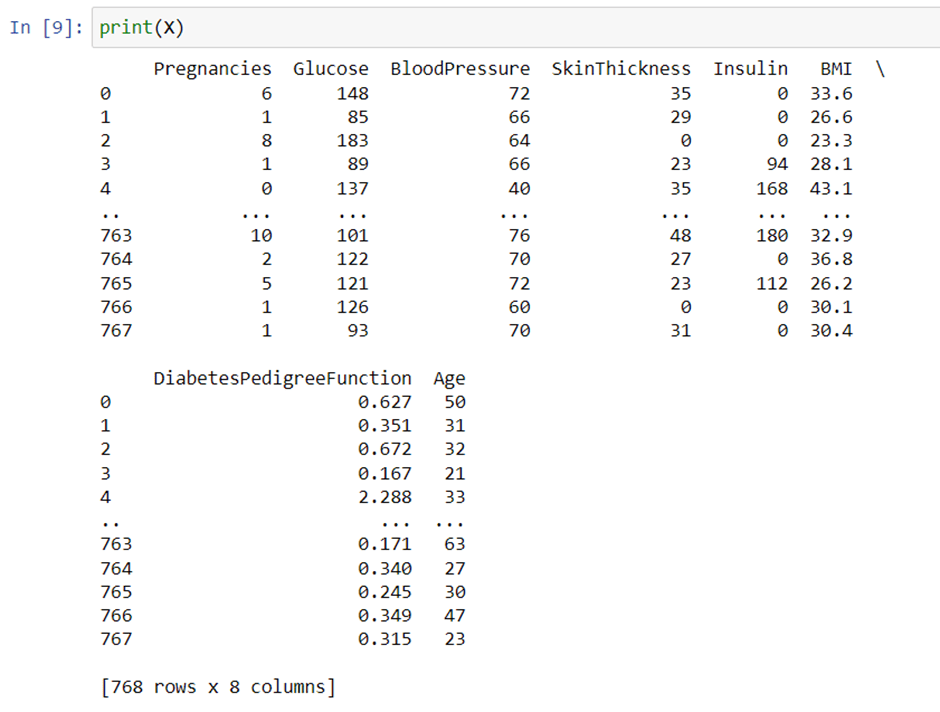
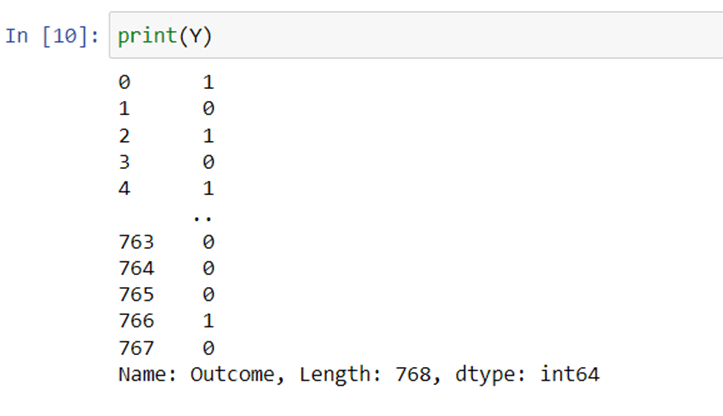
Let’s see our X and Y.
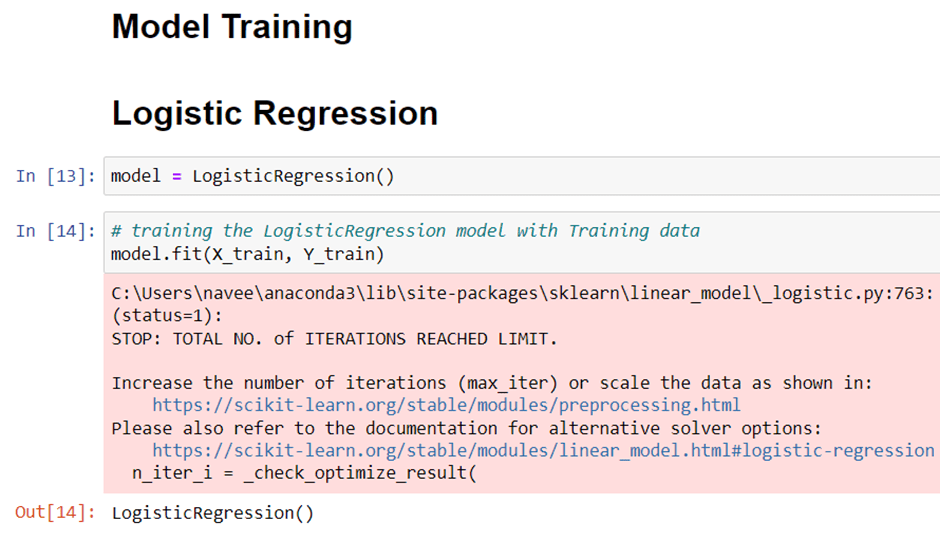
Step 7: Modelling
Step 8: Now we will evaluate our model and check the Accuracy Score of our Model.
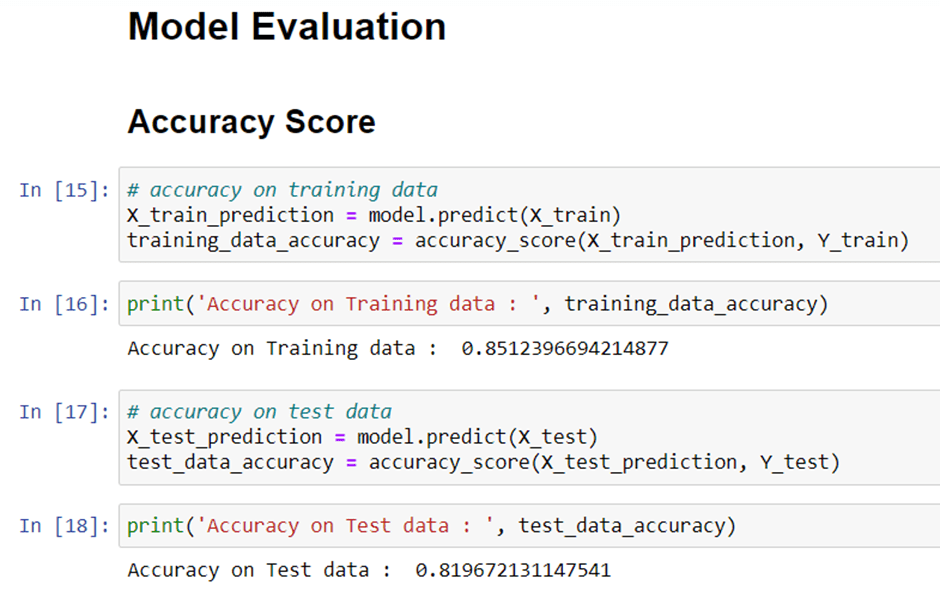
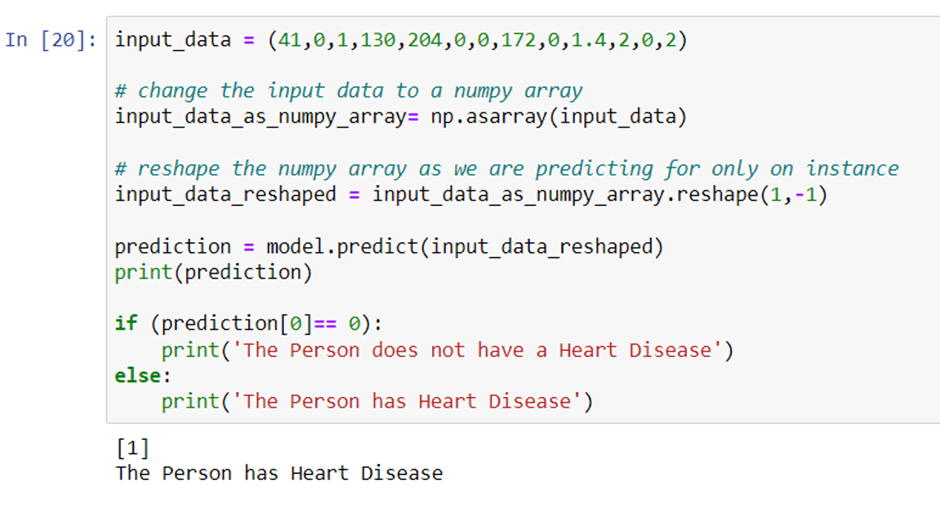
Step 9: we will test our model on test data.

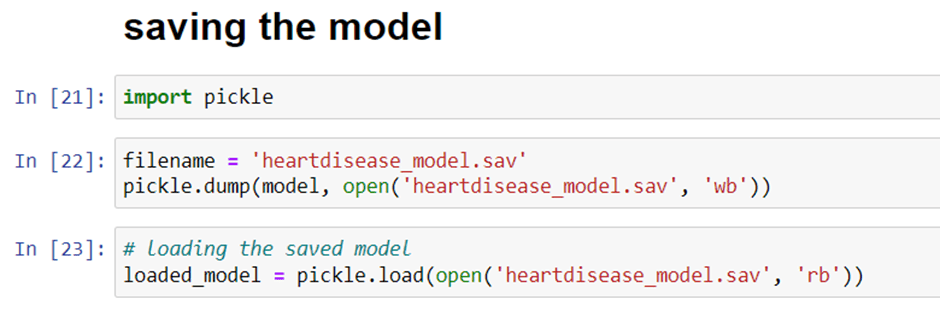
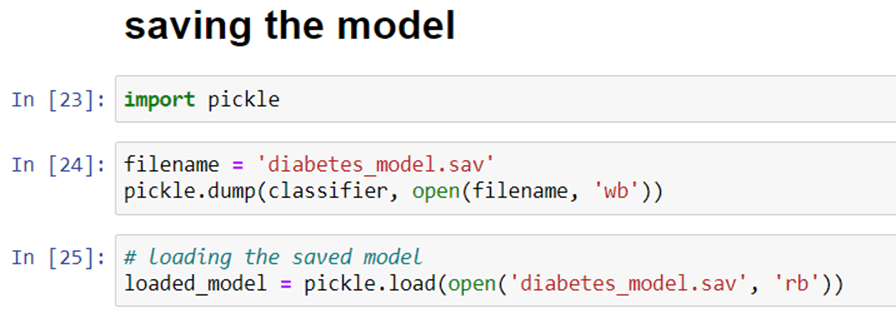
Step 10: Now we will save our Model
Project 2: Diabetes Detection
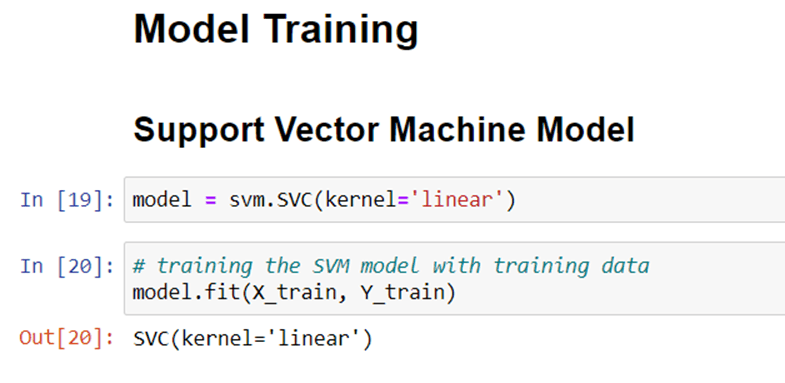
In this second part, we will discuss a project where we will be working on detecting diabetes in people using Machine Learning algorithms. The algorithms used in this project is Support Vector Machine. The dataset can be found here.
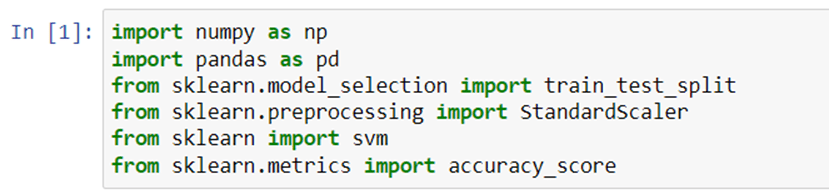
Step 1: firstly, we will be importing all the necessary libraries which we require such as numpy, pandas, matplotlib.
Step 2: we will be loading our data using pandas’s read_csv function and printing the top 5 rows with the help of head() function also we will check the shape of our dataset with shape() function.

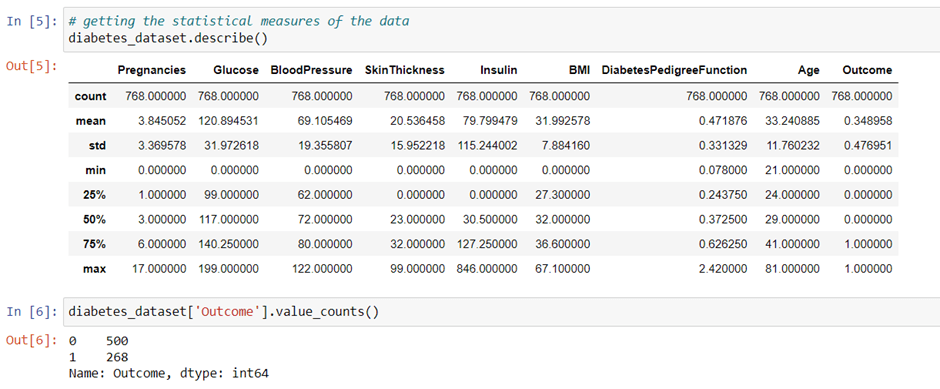
Step 3: let’s look into the description of the data with the describe() method and also distribution of our dataset.
Step 4: now, we will be using Pandas’s groupby()function which is used for grouping the data according to the categories and apply a function to the categories. It also helps to aggregate data efficiently.

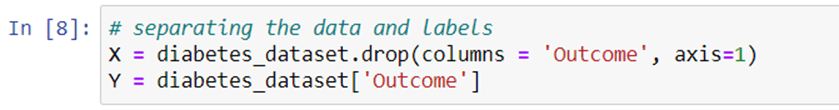
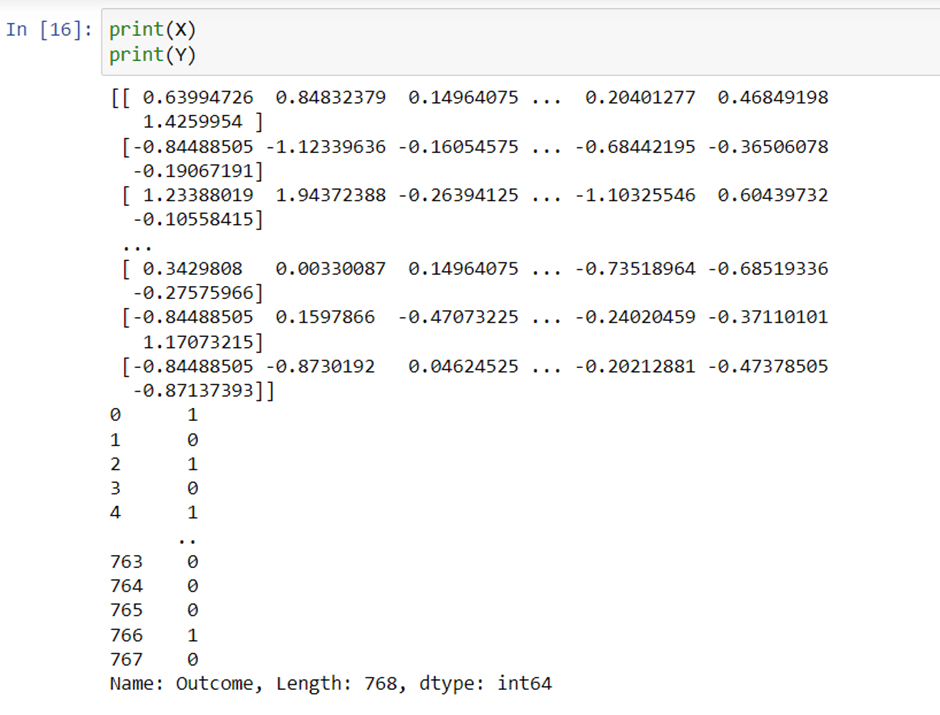
Step 5: now we will separate our data.
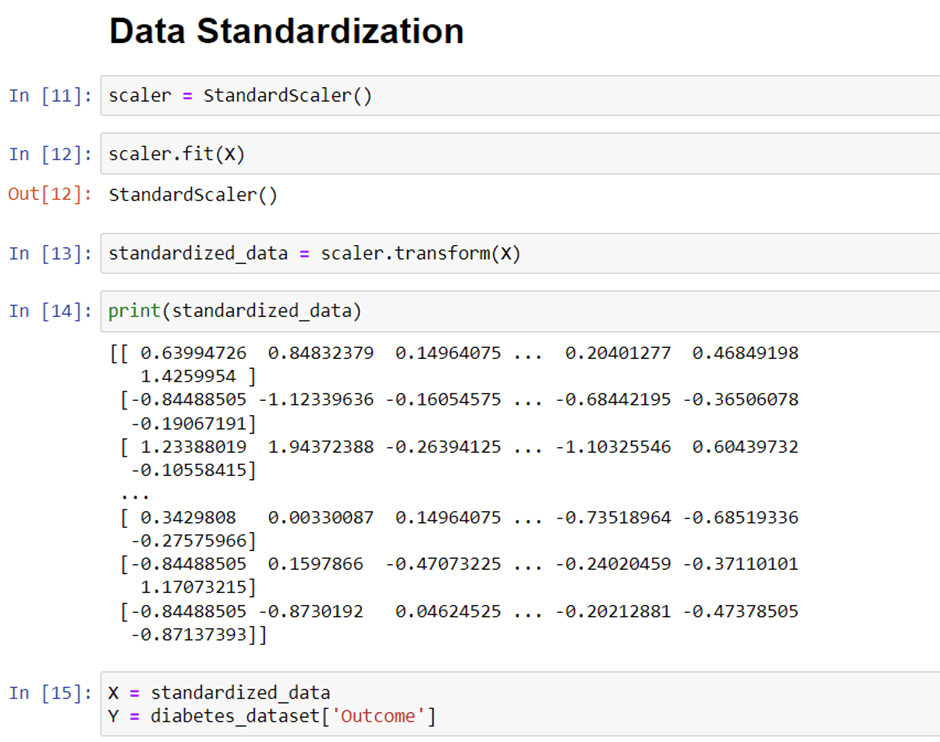
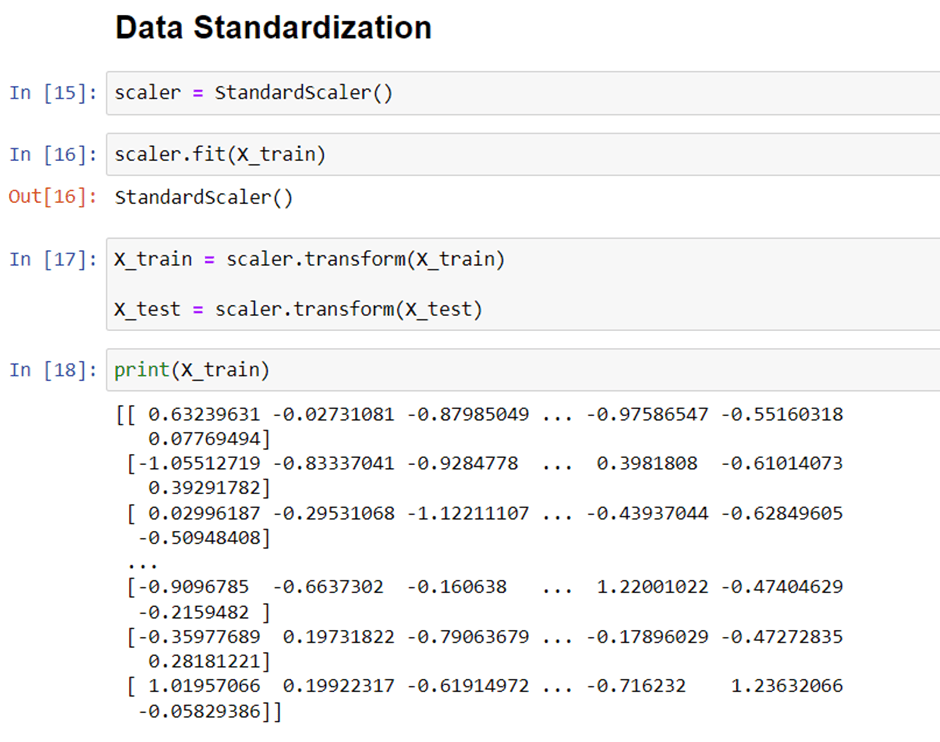
Step 7: now, we will apply standardScaler on our dataset.
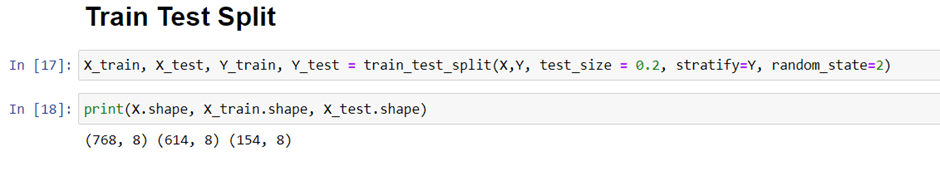
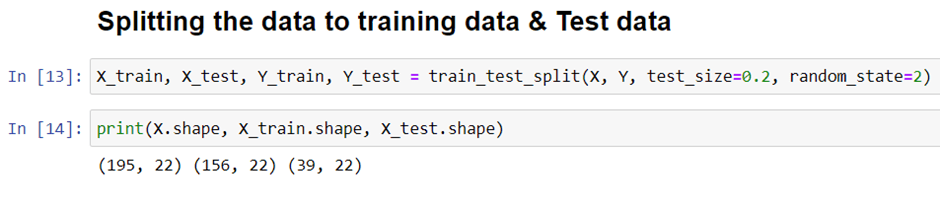
Step 8: now, we will split our data into train and test.
Step 9: Modelling

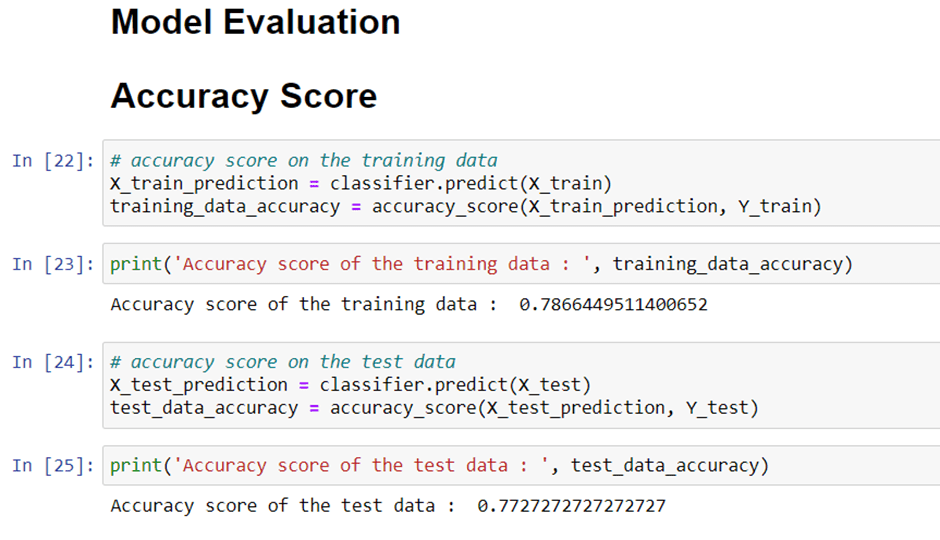
Step 10: Now we will evaluate our model and check the Accuracy Score of our Model and test it on test data.

Step 11: Now we will save our model
Project 3: Parkinsons Disease Detection
In this third part, we will discuss a project where we will be working on detecting Parkinsons Disease in people using Machine Learning algorithms. The algorithms used in this project is Support Vector Machine. The dataset can be found here.
Step 1: firstly, we will be importing all the necessary libraries which we require such as numpy, pandas, matplotlib.
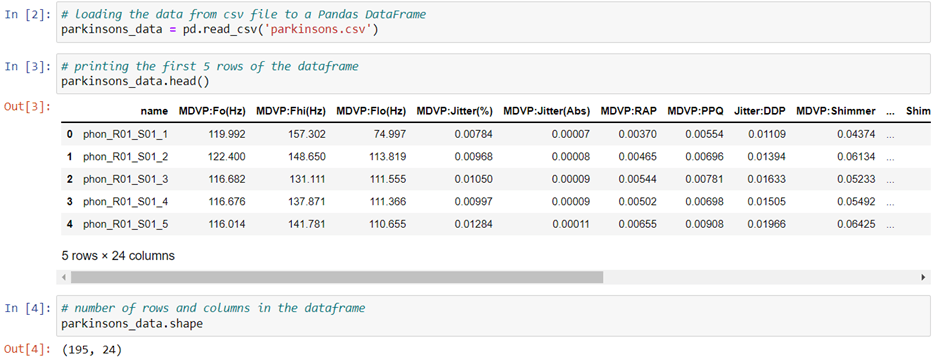
Step 2: we will be loading our data using pandas’s read_csv function and printing the top 5 rows with the help of head() function also we will check the shape of our dataset with shape() function.
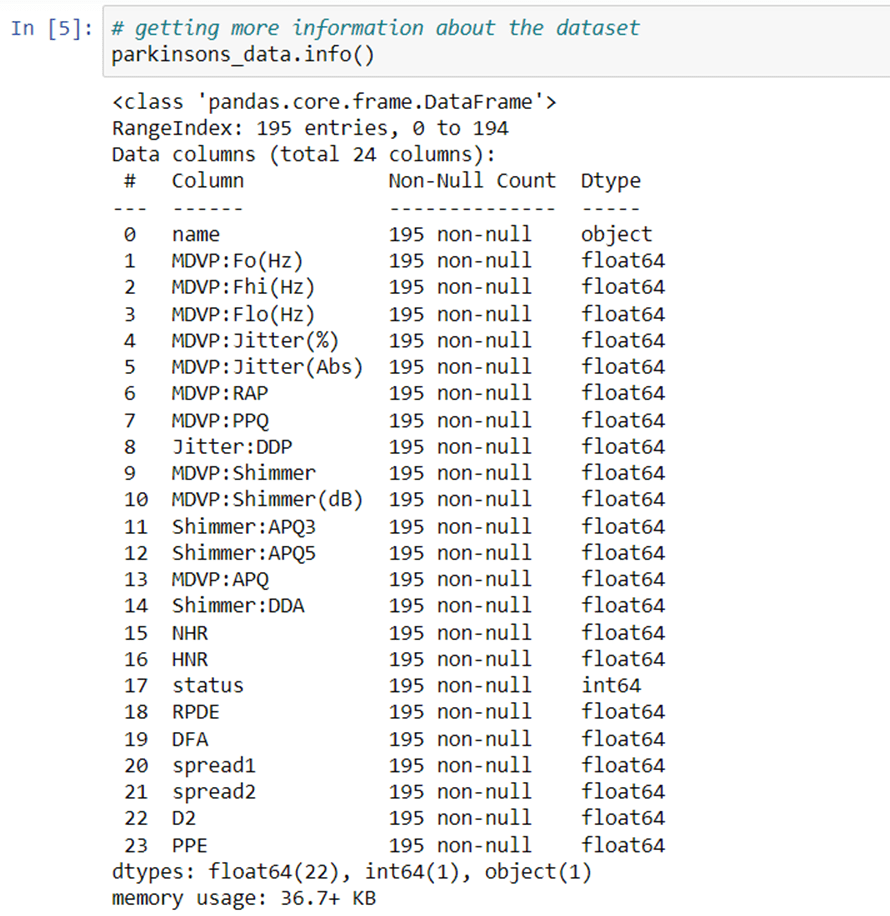
Step 3: Now we will be using info() function which prints information about a DataFrame including the index dtype and columns, non-null values and memory usage.
Step 4: Now, we will check Null values in our data.
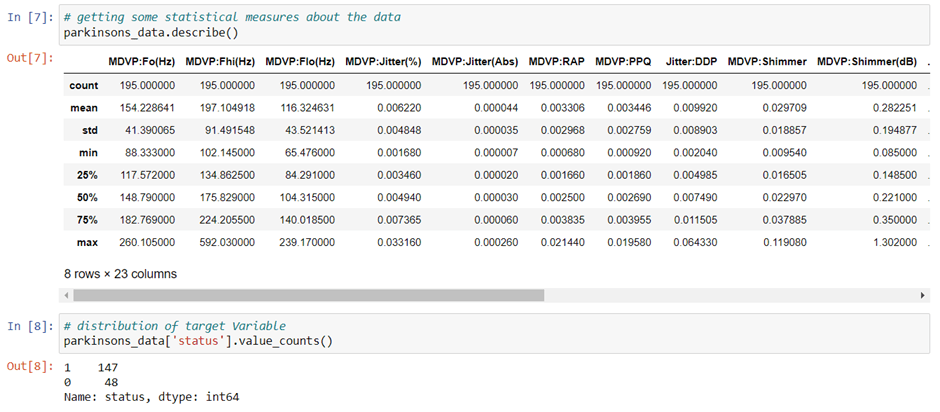
Step 5: let’s look into the description of the data with the describe() method and also distribution of our dataset.
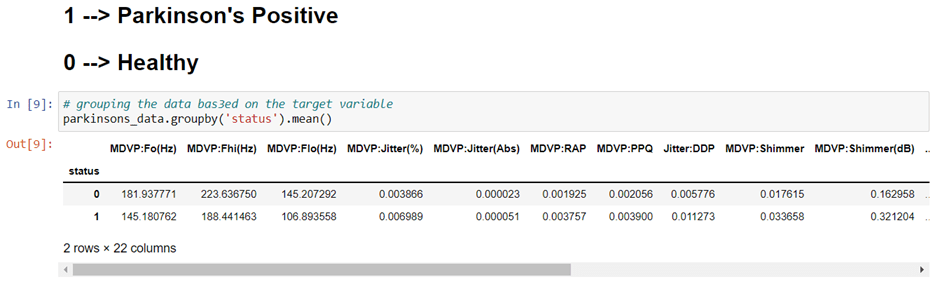
Step 6: now, we will be using Pandas’s groupby()function which is used for grouping the data according to the categories and apply a function to the categories. It also helps to aggregate data efficiently.
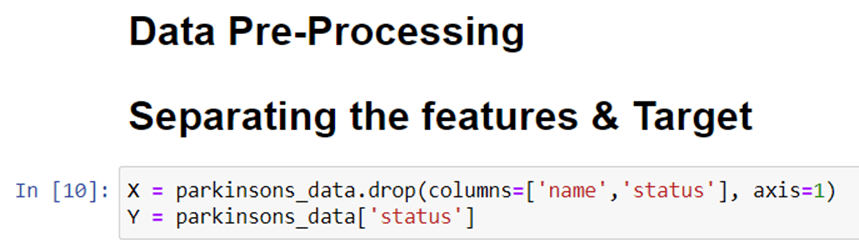
Step 7: we will now separate our data.
Step 8: Let’s split our data into train and test.
Step 9: now, we will standardize our data.
Step 10: Modelling
Step 11: Now we will evaluate our model and check the Accuracy Score of our Model and test it on test data.


Step 12: we will save our model

Create Web Application for Deployment of Multiple Disease Detection Model.
Now we will use streamlit to create a web app to detect multiple disease. In a web application, we need to implement a form that takes all the inputs from users that we have used in a dataset, and by using the dumped model we predict the output and display it to a user.
Streamlit
Streamlit is an open-source web framework written in Python. It is the fastest way to create data apps and it is widely used by data science practitioners to deploy machine learning models. To work with this, it is not important to have any knowledge of frontend languages.
Streamlit contains a wide variety of functionalities, and an in-built function to meet your requirement. It provides you with a plot map, flowcharts, slider, selection box, input field, the concept of caching, etc. install streamlit using the below pip command.
pip install streamlit
create a file named app.py in the same working directory where we will write code for streamlit.
import pickle
import streamlit as st
from streamlit_option_menu import option_menu

# loading the saved models

diabetes_model = pickle.load(open(r'diabetes_model.sav', 'rb'))

heart_disease_model = pickle.load(open(r'heart_disease_model.sav','rb'))

parkinsons_model = pickle.load(open(r'parkinsons_model.sav', 'rb'))


# sidebar for navigation
with st.sidebar:

    selected = option_menu('Multiple Disease Prediction System',

                          ['Diabetes Prediction',
                           'Heart Disease Prediction',
                           'Parkinsons Prediction'],
                          icons=['activity','heart','person'],
                          default_index=0)


# Diabetes Prediction Page
if (selected == 'Diabetes Prediction'):

    # page title
    st.title('Diabetes Prediction using ML')


    # getting the input data from the user
    col1, col2, col3 = st.columns(3)

    with col1:
        Pregnancies = st.text_input('Number of Pregnancies')

    with col2:
        Glucose = st.text_input('Glucose Level')

    with col3:
        BloodPressure = st.text_input('Blood Pressure value')

    with col1:
        SkinThickness = st.text_input('Skin Thickness value')

    with col2:
        Insulin = st.text_input('Insulin Level')

    with col3:
        BMI = st.text_input('BMI value')

    with col1:
        DiabetesPedigreeFunction = st.text_input('Diabetes Pedigree Function value')

    with col2:
        Age = st.text_input('Age of the Person')


    # code for Prediction
    diab_diagnosis = ''

    # creating a button for Prediction

    if st.button('Diabetes Test Result'):
        diab_prediction = diabetes_model.predict([[Pregnancies, Glucose, BloodPressure, SkinThickness, Insulin, BMI, DiabetesPedigreeFunction, Age]])

        if (diab_prediction[0] == 1):
          diab_diagnosis = 'The person is diabetic'
        else:
          diab_diagnosis = 'The person is not diabetic'

    st.success(diab_diagnosis)


# Heart Disease Prediction Page
if (selected == 'Heart Disease Prediction'):

    # page title
    st.title('Heart Disease Prediction using ML')

    col1, col2, col3 = st.columns(3)

    with col1:
        age = st.text_input('Age')

    with col2:
        sex = st.text_input('Sex')

    with col3:
        cp = st.text_input('Chest Pain types')

    with col1:
        trestbps = st.text_input('Resting Blood Pressure')

    with col2:
        chol = st.text_input('Serum Cholestoral in mg/dl')

    with col3:
        fbs = st.text_input('Fasting Blood Sugar > 120 mg/dl')

    with col1:
        restecg = st.text_input('Resting Electrocardiographic results')

    with col2:
        thalach = st.text_input('Maximum Heart Rate achieved')

    with col3:
        exang = st.text_input('Exercise Induced Angina')

    with col1:
        oldpeak = st.text_input('ST depression induced by exercise')

    with col2:
        slope = st.text_input('Slope of the peak exercise ST segment')

    with col3:
        ca = st.text_input('Major vessels colored by flourosopy')

    with col1:
        thal = st.text_input('thal: 0 = normal; 1 = fixed defect; 2 = reversable defect')


    # code for Prediction
    heart_diagnosis = ''

    # creating a button for Prediction

    if st.button('Heart Disease Test Result'):
        heart_prediction = heart_disease_model.predict([[age, sex, cp, trestbps, chol, fbs, restecg,thalach,exang,oldpeak,slope,ca,thal]])

        if (heart_prediction[0] == 1):
          heart_diagnosis = 'The person is having heart disease'
        else:
          heart_diagnosis = 'The person does not have any heart disease'

    st.success(heart_diagnosis)


# Parkinson's Prediction Page
if (selected == "Parkinsons Prediction"):

    # page title
    st.title("Parkinson's Disease Prediction using ML")

    col1, col2, col3, col4, col5 = st.columns(5)

    with col1:
        fo = st.text_input('MDVP:Fo(Hz)')

    with col2:
        fhi = st.text_input('MDVP:Fhi(Hz)')

    with col3:
        flo = st.text_input('MDVP:Flo(Hz)')

    with col4:
        Jitter_percent = st.text_input('MDVP:Jitter(%)')

    with col5:
        Jitter_Abs = st.text_input('MDVP:Jitter(Abs)')

    with col1:
        RAP = st.text_input('MDVP:RAP')

    with col2:
        PPQ = st.text_input('MDVP:PPQ')

    with col3:
        DDP = st.text_input('Jitter:DDP')

    with col4:
        Shimmer = st.text_input('MDVP:Shimmer')

    with col5:
        Shimmer_dB = st.text_input('MDVP:Shimmer(dB)')

    with col1:
        APQ3 = st.text_input('Shimmer:APQ3')

    with col2:
        APQ5 = st.text_input('Shimmer:APQ5')

    with col3:
        APQ = st.text_input('MDVP:APQ')

    with col4:
        DDA = st.text_input('Shimmer:DDA')

    with col5:
        NHR = st.text_input('NHR')

    with col1:
        HNR = st.text_input('HNR')

    with col2:
        RPDE = st.text_input('RPDE')

    with col3:
        DFA = st.text_input('DFA')

    with col4:
        spread1 = st.text_input('spread1')

    with col5:
        spread2 = st.text_input('spread2')

    with col1:
        D2 = st.text_input('D2')

    with col2:
        PPE = st.text_input('PPE')


    # code for Prediction
    parkinsons_diagnosis = ''

    # creating a button for Prediction
    if st.button("Parkinson's Test Result"):
        parkinsons_prediction = parkinsons_model.predict([[fo, fhi, flo, Jitter_percent, Jitter_Abs, RAP, PPQ,DDP,Shimmer,Shimmer_dB,APQ3,APQ5,APQ,DDA,NHR,HNR,RPDE,DFA,spread1,spread2,D2,PPE]])

        if (parkinsons_prediction[0] == 1):
          parkinsons_diagnosis = "The person has Parkinson's disease"
        else:
          parkinsons_diagnosis = "The person does not have Parkinson's disease"

    st.success(parkinsons_diagnosis)
Now when you run the app file using this streamlit run app.py command you will get two URL and it will automatically open the web application in your default browser or copy the URL and open it. the application will look something like the below figure.
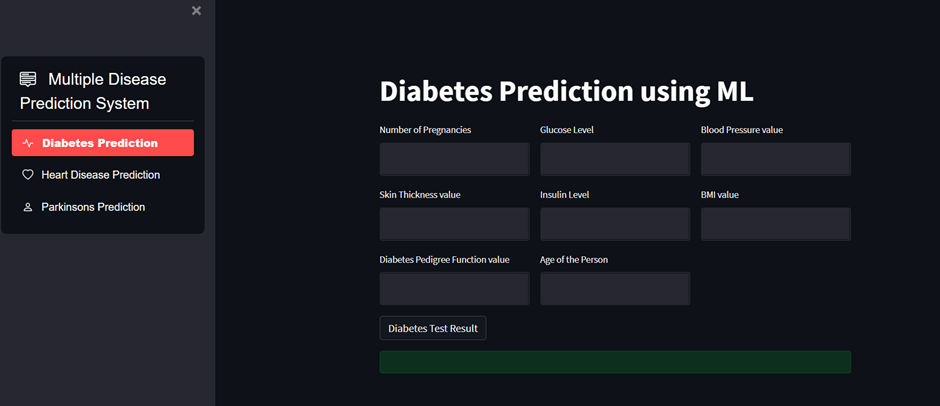
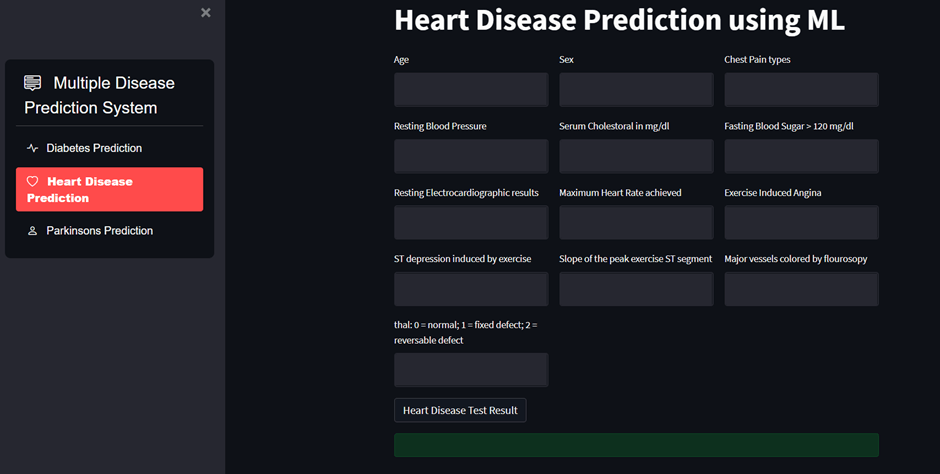
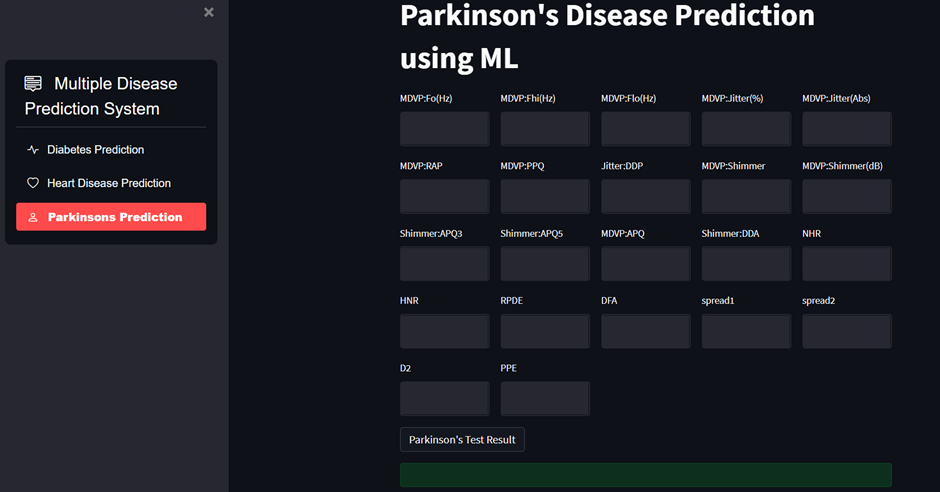
Enter some data in each field and click on predict button to generate prediction. I hope you got the desired results and the application is working fine.
Great, we have successfully developed a machine learning application for the prediction of multiple disease. We have learned about the complete machine learning project lifecycle with practical implementation and how to approach a particular problem. I believe this post motivates and encourage you to develop similar more application to enhance your understanding of various methods and algorithms to use and twin with different parameters.

I like this weblog its a master peace ! Glad I discovered this on google .