Netflix is one of the most popular streaming services in the world, with a massive subscriber base. In this article we’re going to explore how data scientists can use Python to analyze Netflix data from various perspectives: how you watch Netflix and what you do once it finishes.
As we have already worked with Jupyter notebook in our previous project so, in this project we will be using again Jupyter for analysis Netflix data.

You can download the dataset by clicking here. if any issues in downloading Contact US
Firstly, we will import the following libraries: pandas, numpy, matplotlib, and seaborn.
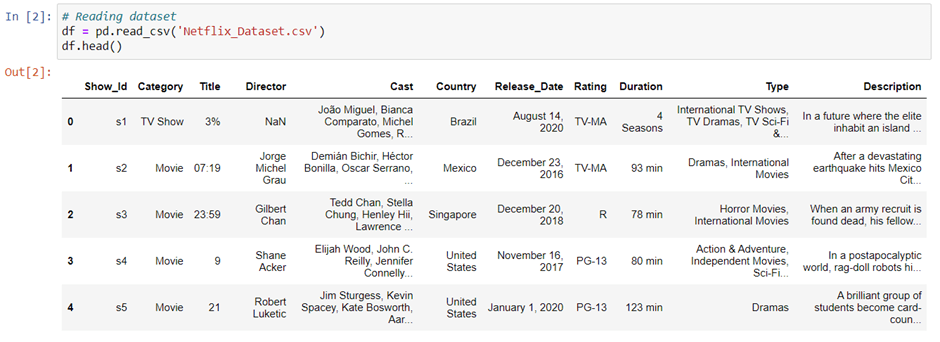
The dataset can be read with the help of Python’s function read_csv. I have stored the dataset in the folder. Let’s import and view the first five rows using the head() function.
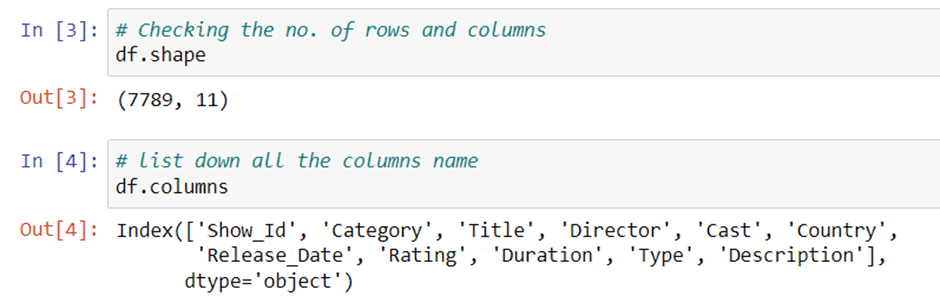
To check the no. of rows and columns in your dataset you can use shape function, and if you want to see all the columns name then you can use the columns function.
Check the datatype with the help of Pandas library’s info() function.

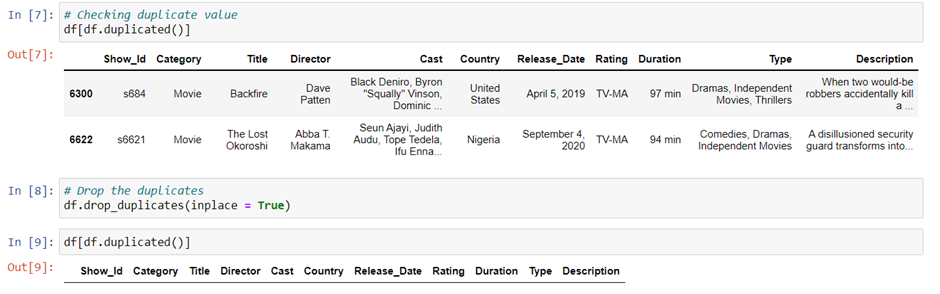
- If there is any duplicate value in the dataset, then remove it with the drop_duplicated() function.
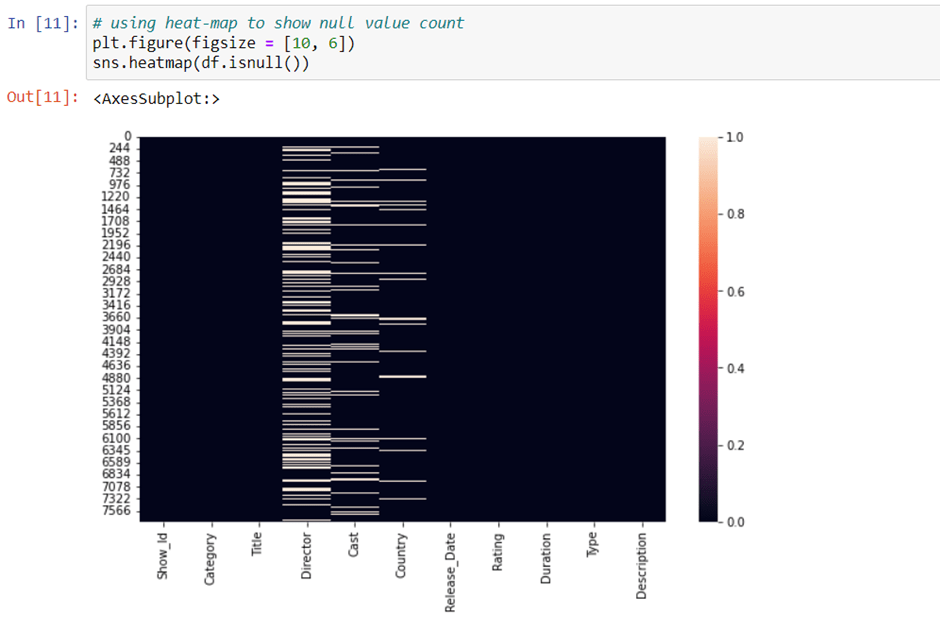
- If there are null value in the data set then show it with the heat-map.
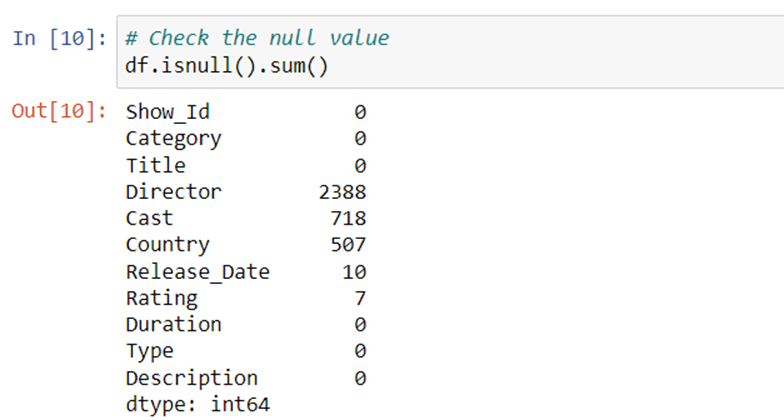
As we can see that in the Director, cast, Country, Release_Date and Rating columns has null values so, we will show this with the help of heatmap.
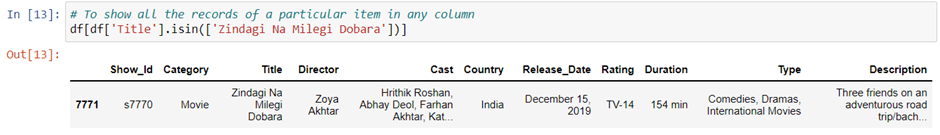
- For ‘Zindagi Na Milegi Dobara’ what is show idd and who is the director of this show?
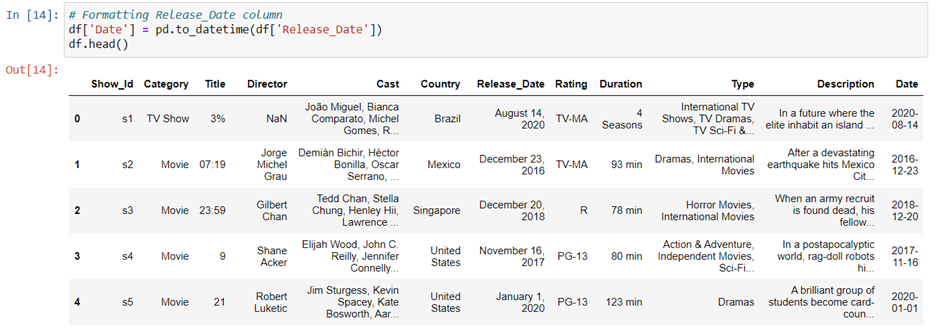
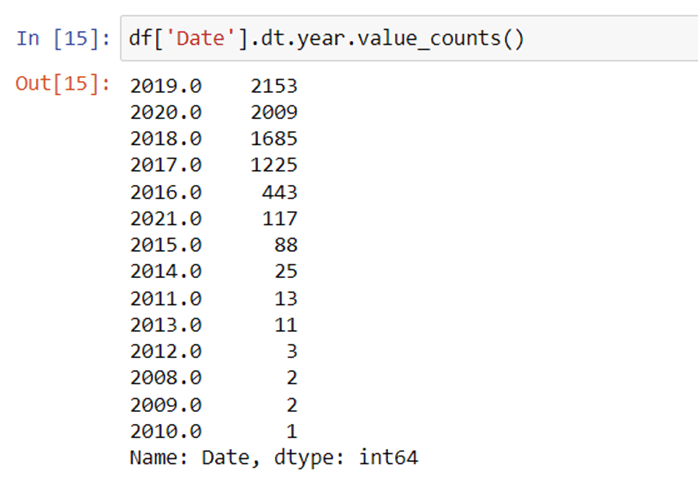
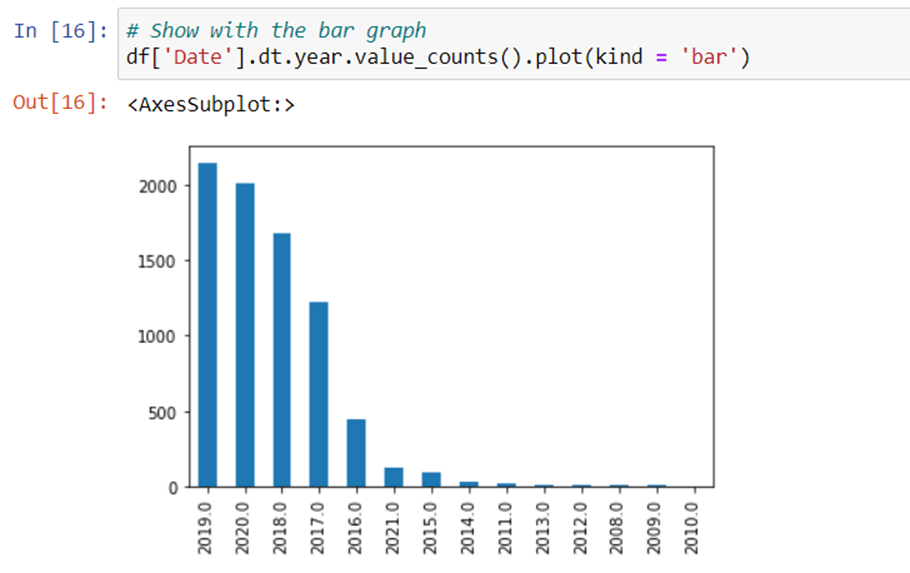
- In which year highest number of TV Shows and Movies were released? Show with bar graph.
We will be using value_counts() function to know which year highest TV Shows and Movies were released.
- How many movies and shows are in the dataset? Show with the bar graph.


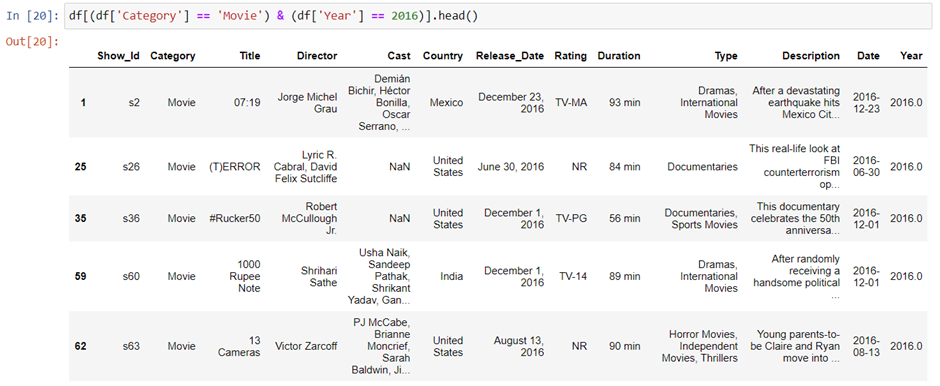
- Show all the Movies that were released in 2016.

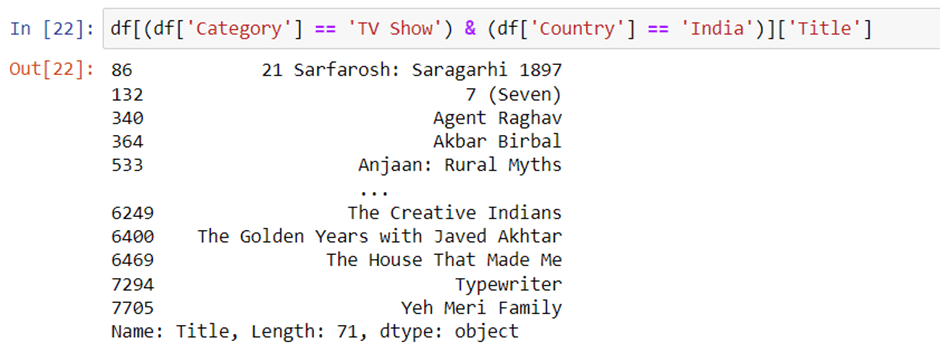
- Show only the titles of all the TV Shows that were released in India.
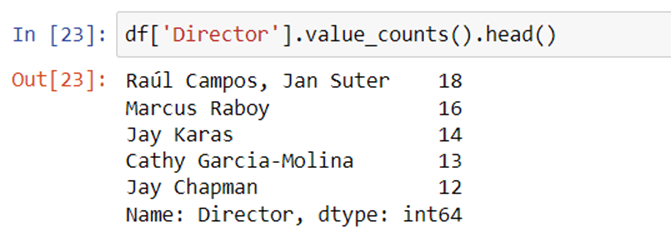
- Show top 5 directors who gave highest number of TV Shows and Movies to Netflix.
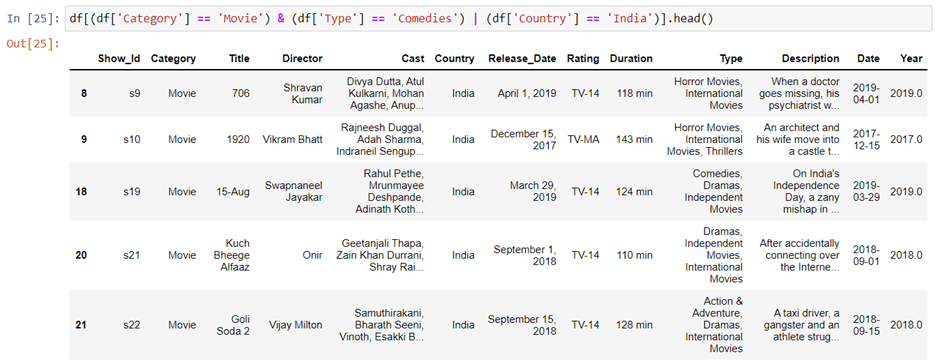
- Show all the records where ‘Category is Movies and Type is Comedies’ or ‘Country is India.
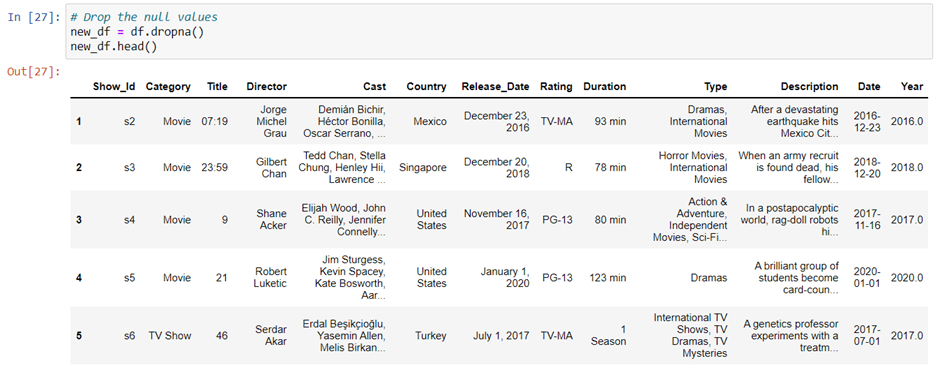
- Drop the null values from the dataset with the help of dropna() function
- In how many TV Shows/Movies Rajneesh Duggal was casted?

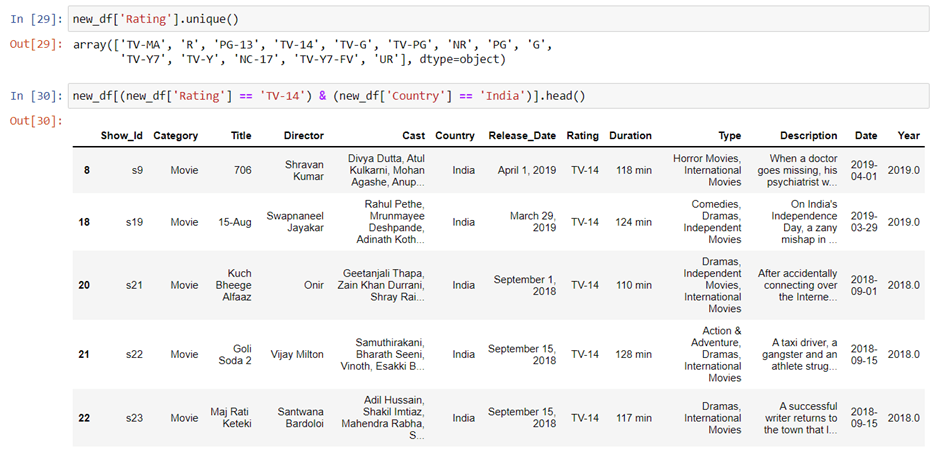
- What are the different rating defined by Netflix, and how many Movies got TV-14 Rating in India?
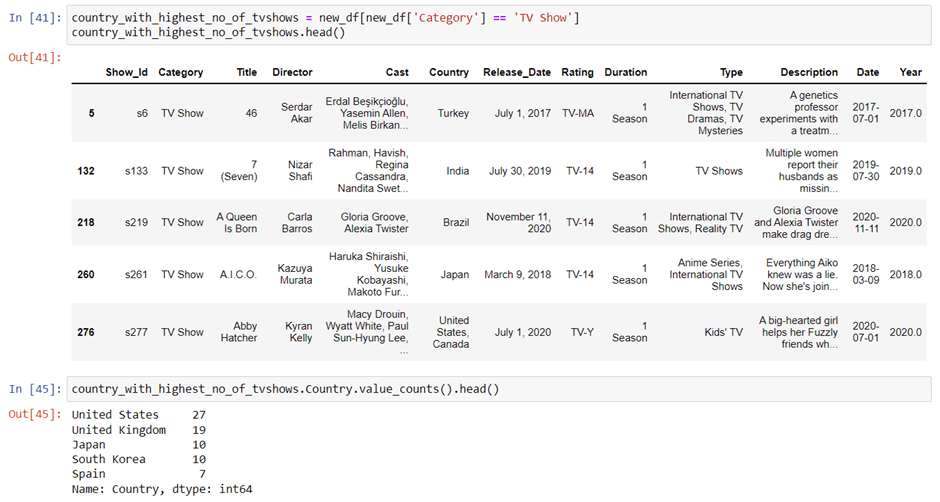
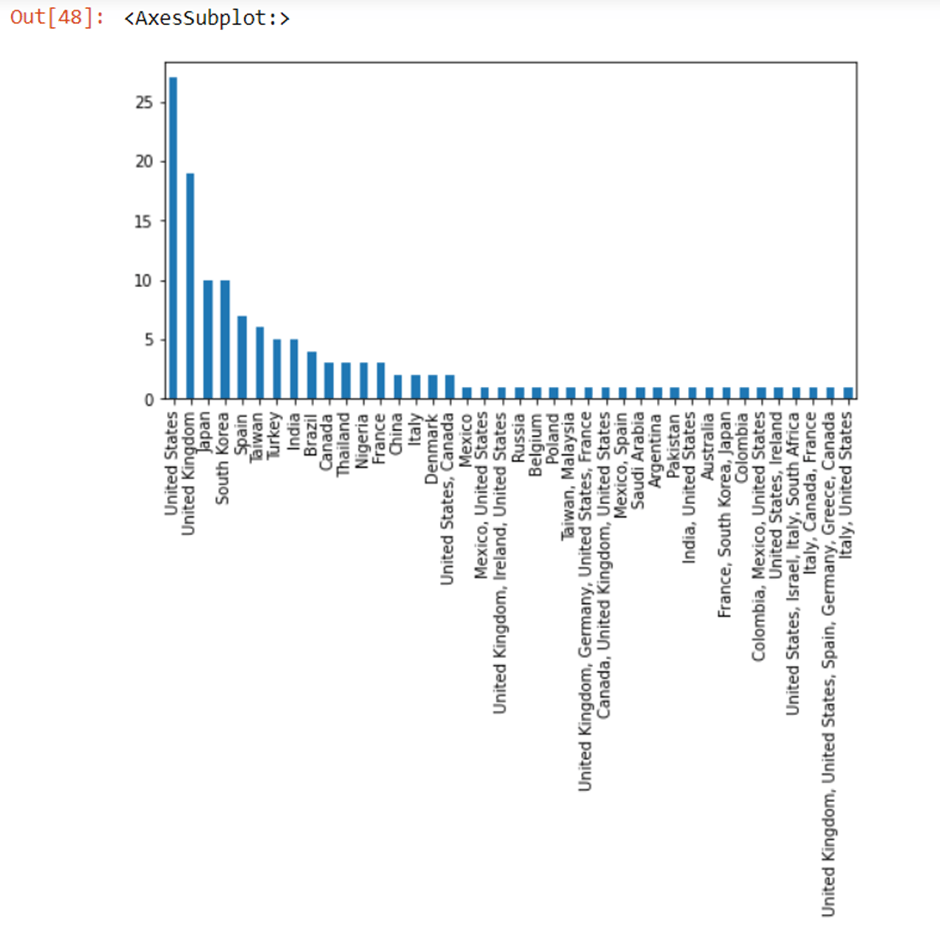
- Which country has the highest no. of TV Shows? Show with the bar graph.