In this post, I use Python, Pandas & Matplotlib to analyze and answer business questions about 12 months worth of sales data. The data contains hundreds of thousands of electronics store purchases broken down by month, product type, cost, purchase address, etc. The dataset can be downloaded here. In this analysis, I’m using jupyter notebook.
First, we will import the necessary library like pandas, numpy, seaborn and matplotlib.
We use panda to read the csv file and create a dataframe from it. Now the first task is to merge all 12 months’ worth of sales data (12 csv files) into a single csv file. To do that, we need to import new library called os.
We need os library to read all csv files’ title and call it using for loop. As you can see below.
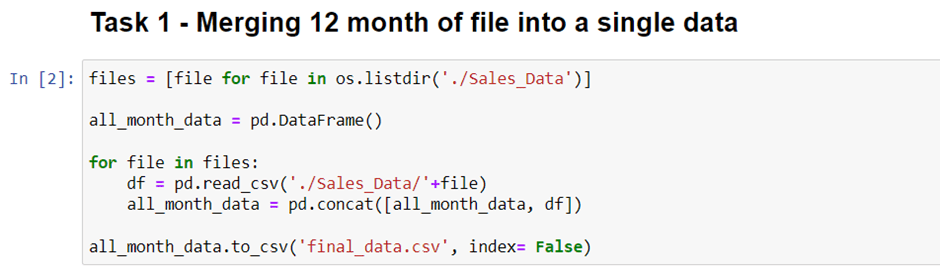
It will take a little longer time because of heavy computation. But once it’s done. You will see a new csv file contains all 12 months data in your directory.
After we create this new csv file, you can delete the previous code (if you want) and we will use this file to answer all of the problems.
Now we only use this code to read all of 12 months data.

Now, we will check NaN values. There are NaN values in our data. You could spot on of NaN value in our dataset. Now we need to clean up the data by dropping rows of NaN.
We isnull().sum() to check the NaN values. Now, we’re gonna remove it from our dataframe using .dropna() method.

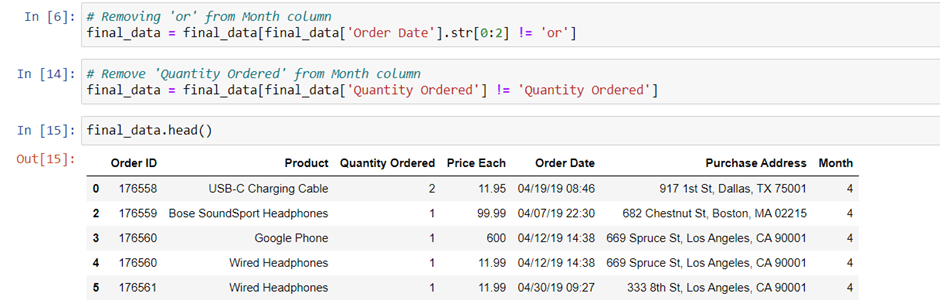
dropna() method is successful, but we get a new issue here. There are values “Or” and in our Quantity Ordered columns one rows has “Quantity Ordered” value in our data.
We need to drop this “Or” and “Quantity Ordered” rows just simply change the equal sign (“==”) to not equal sign (“!=”).
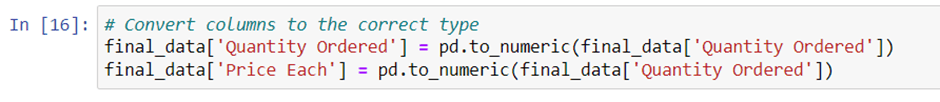
the next task is to convert these columns to the correct type (“Quantity Ordered” is integer and “Price Each” is float). We’re gonna use pd.to_numeric() method to convert them to numeric.
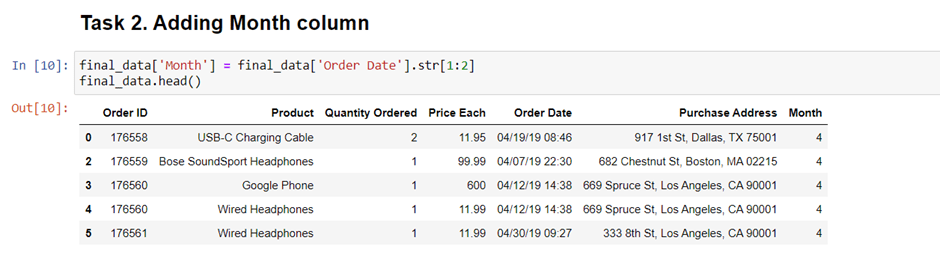
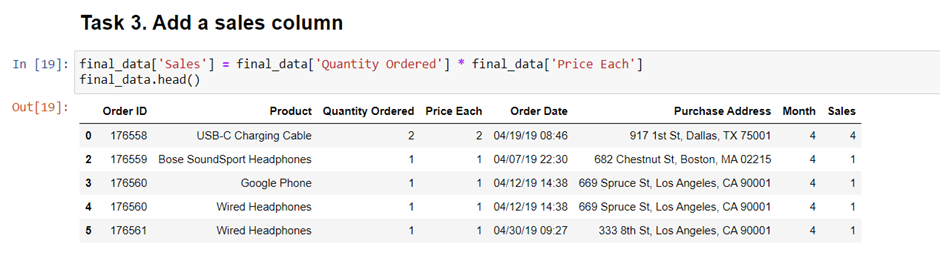
We will create “Month” and “Sales” column. Now, are we ready to answer the question? Not yet, we need obviously one more column called “Sales” Column. How can we get that? We get “Sales” by multiplying “Quantity Ordered” and “Price Each” values. Let’s create it.
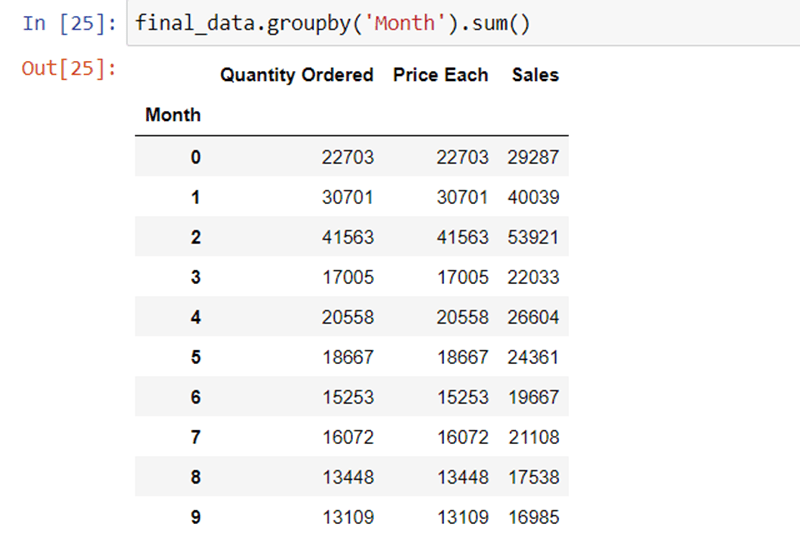
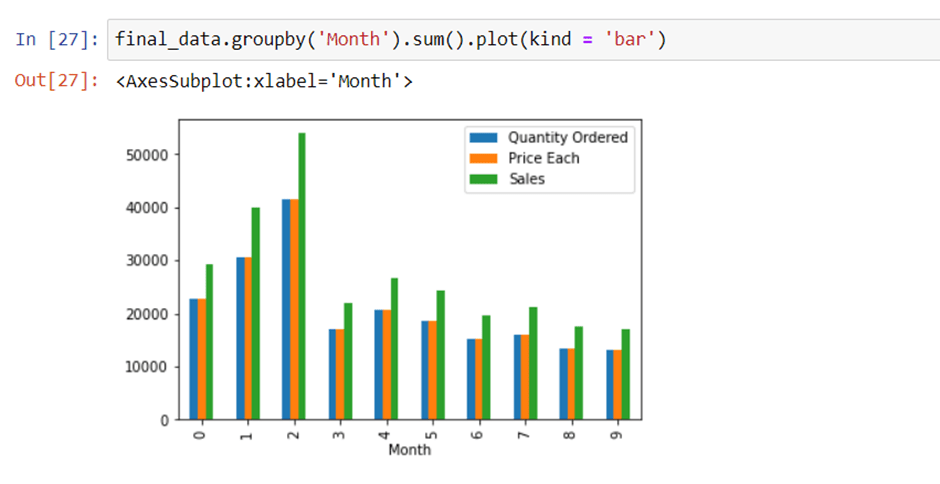
Question 1. What was the best month for Sales? How much was earned that month?
We can easily answer it by we using groupby(‘Month’).sum() method.
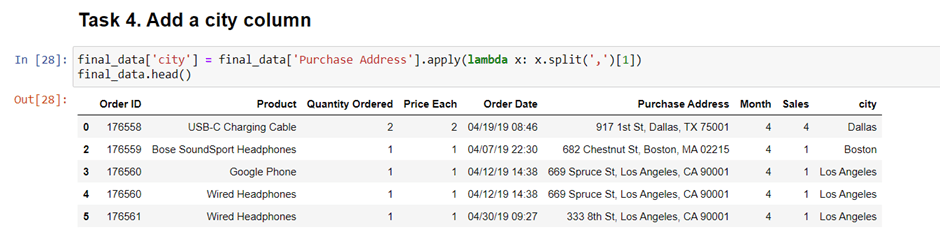
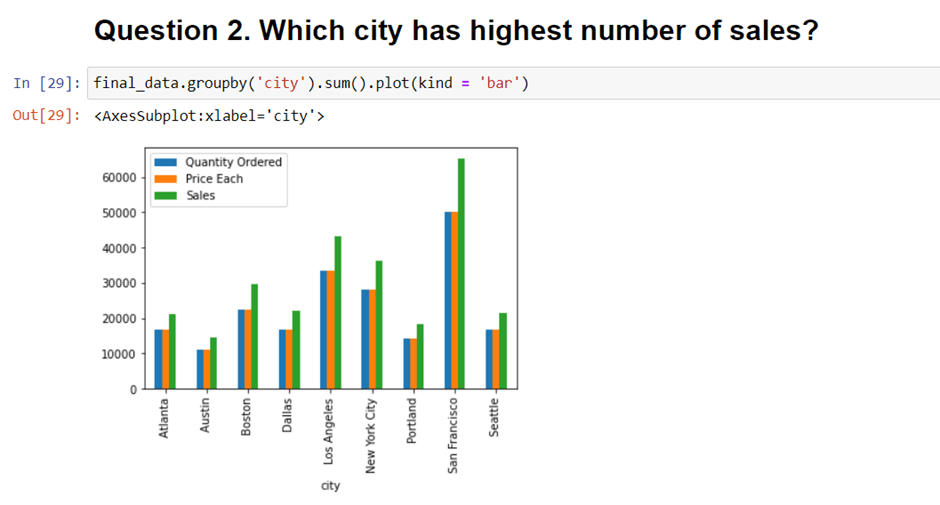
Question 2. Which city has highest number of sales?
we will be adding one new “city” column to answer this question.
Question 3. What time should we display advertisements to increase customer likelihood of buying product?
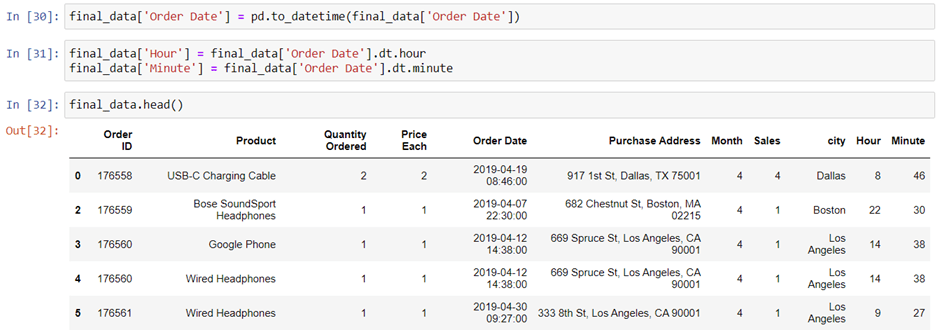
If we’re gonna use our data to answer this question, we need to aggregate the period in 24 hours distribution. In “Order Date” column, there are times data. We could extract it like we did before. But to make it more consistent, we need to convert the “Order Date” Column into date time object. We’re gonna use pd.to_datetime() method.
It will take a little bit longer because of the heavy calculation. Now we can create a new column called “Hour” contain the extraction of “Order_Date” data. We only need the hours data, so we can extract them by doing this.
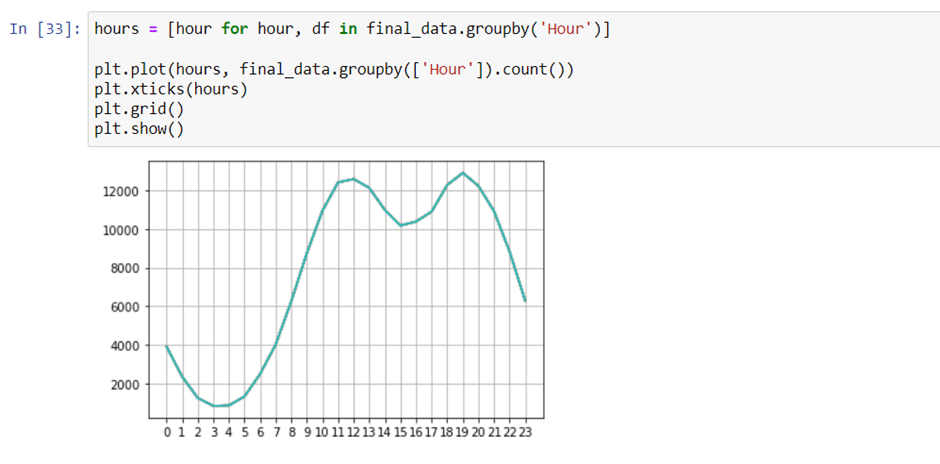
Now we can answer the third question, what time should we display advertisements to maximize likelihood of customer’s buying product? To answer this, we’re gonna group it by the hours and counting all of the orders.
We can see that “Order ID” indicate the transaction. So by grouping the product by the Order ID, we are able to know what products are often sold together. We’re gonna use duplicated() method to find a duplicate values of “Order ID”.
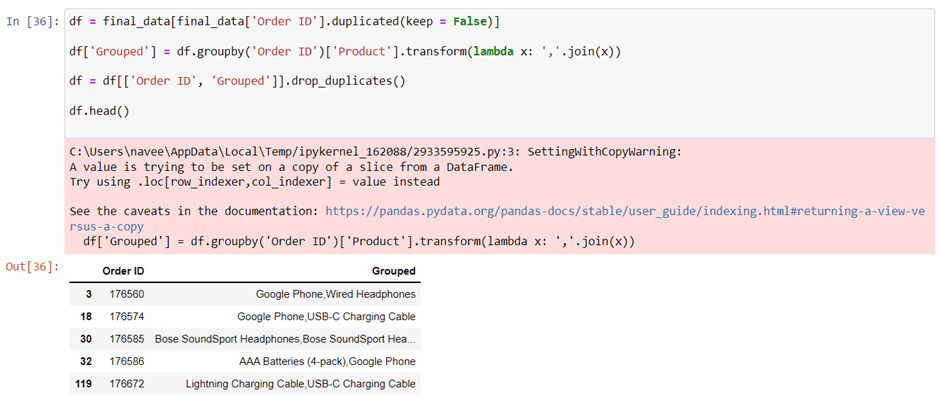
Now we want to create a column called “Grouped” that contain example Google Phone and Wired Headphone (transaction 17650) at the same line. We’re gonna use the transform() method to join values from two rows into a single row.
It’s good, but we have an issue here. We have the same order at least twice because we did merge them in every situation in groupby without dropping the duplicate values. Now let’s drop the rows with duplicate values.
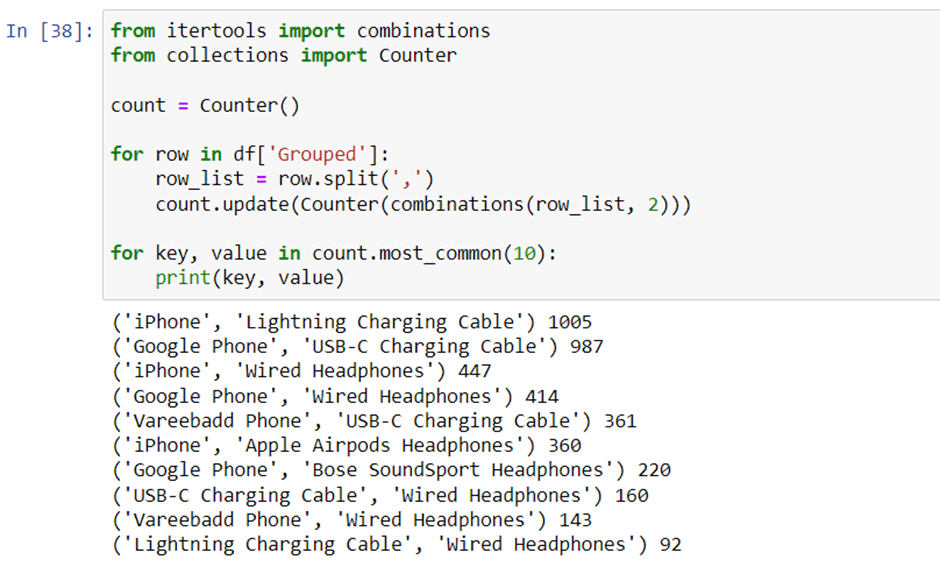
Now, we need to count the pair of products. We need new libraries because they have all we need to count all the combination of products bundle. We’re gonna use itertools and collections libraries.
It’s too messy, let’s just showing the top 10 data