Machine learning relies on AI to predict the future based on past data. If you’re a data science enthusiast or practitioner, this article will help you build your own end-to-end machine learning project from scratch. In order for a machine-learning project to be successful, there are several steps that should be followed. These steps vary from project to project and can depend on the type of data that is available. In this article, we will go through a laptop price prediction example and highlight various important steps in the process.
The problem statement for laptop price prediction is
We will make a project to predict the price of laptops based on user input. The problem we are addressing is that there are many different combinations of configurations that can be done, so if people want to buy a new laptop, then our app should have all the prices sorted by their configuration. Although it looks like a simple project or just developing a model, the dataset we have is noisy and needs lots of feature engineering, and pre-processing that will make your interest in developing this project higher.
Dataset for Laptop Price Prediction
You can download the dataset from here. Most of the columns in a dataset are noisy and contain lots of information but with feature engineering, you will get more good results. The only problem is that we are lacking data. But it’s still possible to get a good accuracy with it. The only thing is that it’s better to have more data because then the website will be able to give the user a more accurate price of laptops based on their configuration.
Basic Understanding of Laptop Price Prediction Data
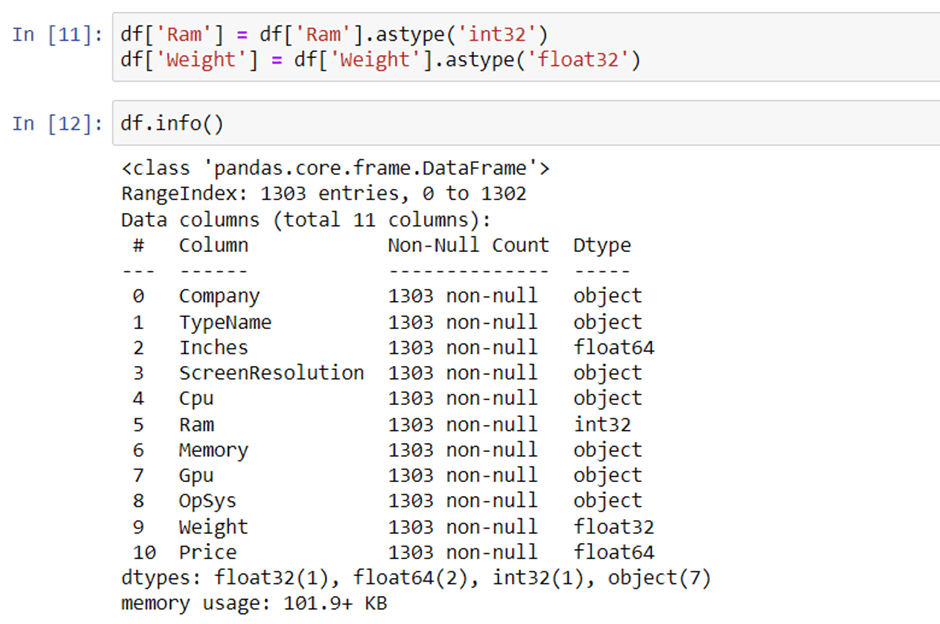
In Jupyter Notebook, let’s import the libraries and load our data. Data is an important part of machine learning. After we’ve taken a look at the head, shape, info, any NULL values and duplicate values, there are a few more things to consider.


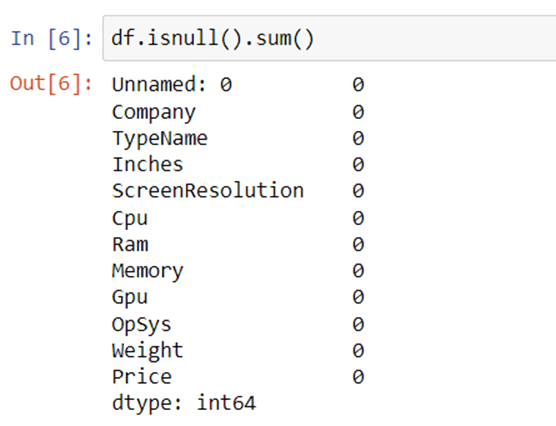
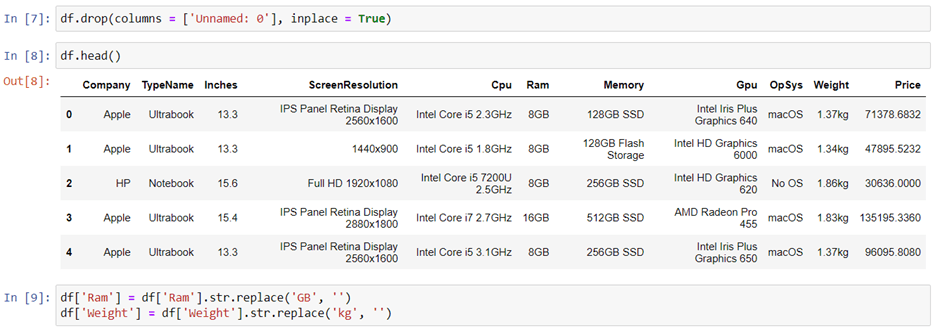
It’s good that there are no NULL values. And we need to make slight changes in weight and Ram column to convert them to numeric by removing the unit written after the value. So, we will perform data cleaning here to get the correct types of columns.
Exploratory Data Analysis
Exploratory analysis is the process of understanding your data. This can help you to identify patterns and features for you to use in machine learning algorithms. By identifying the trends and commonalities in your data, you are able to avoid a lot of guesswork and make better-informed decisions. EDA is types of analysis including univariate, bivariate, or multivariate. EDA analysis helps you to prove some of your assumptions are true or false. It helps you to perform hypothesis testing.
1. Distribution of target column
Regression analysis is an important part of any problem statement. The distribution of your column can affect the results, and you should be aware of these possible scenarios.
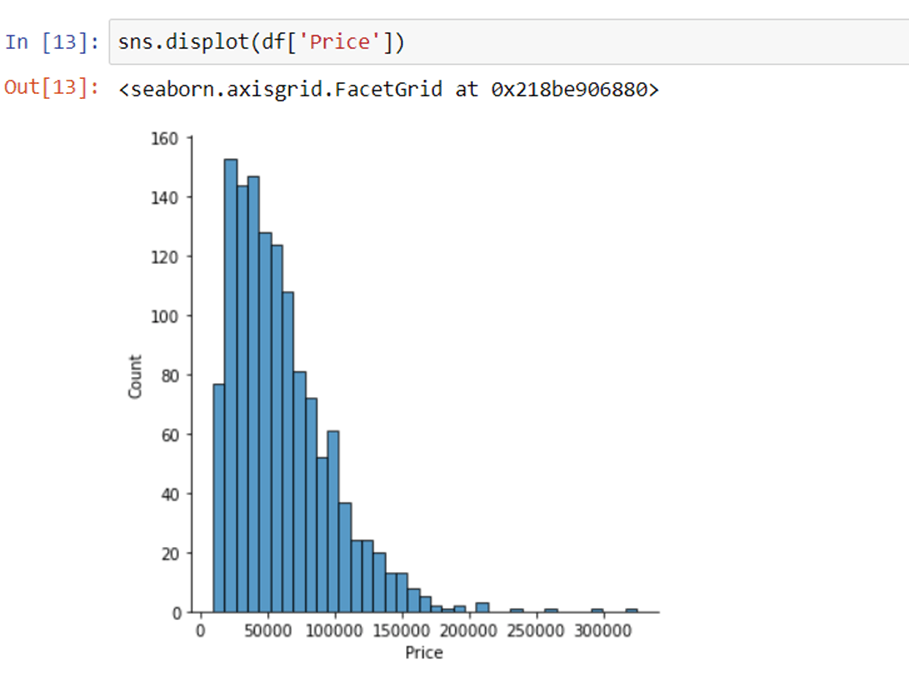
The distribution of the target variable is skewed and it is obvious that low-price commodities are sold rather than branded ones.
2. Distribution of company name
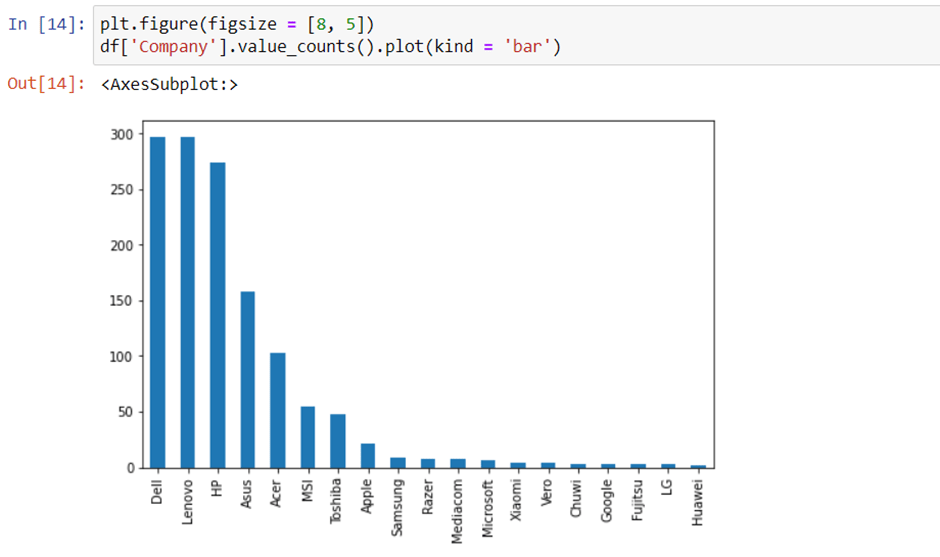
We can see which company has the higher number of laptops.
3. Company column
When you plot a count plot(frequency) of a company, then the major categories that are present are Lenovo, Dell, HP, Asus and other brands
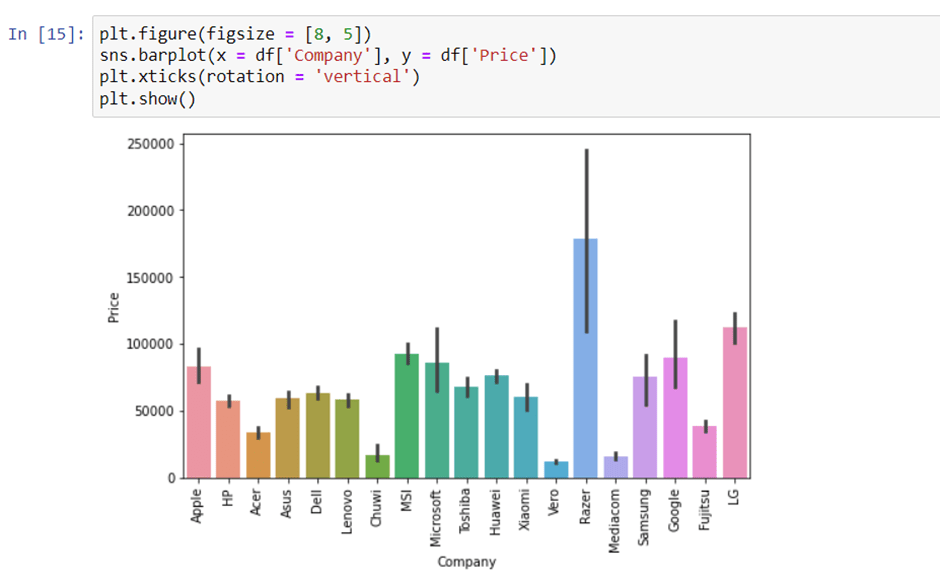
Now if we plot the company relationship with price then you can observe that how price varies with different brands.
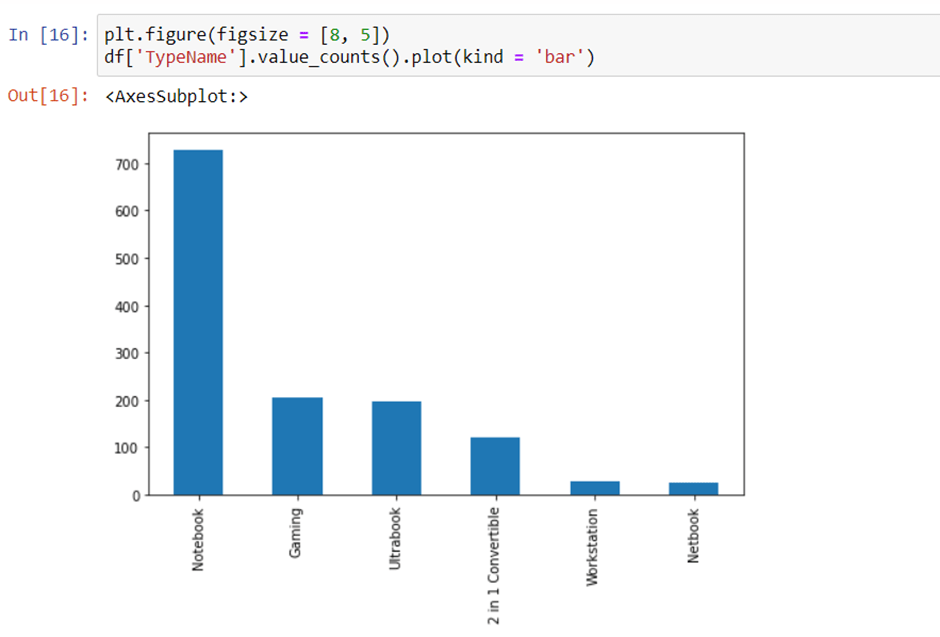
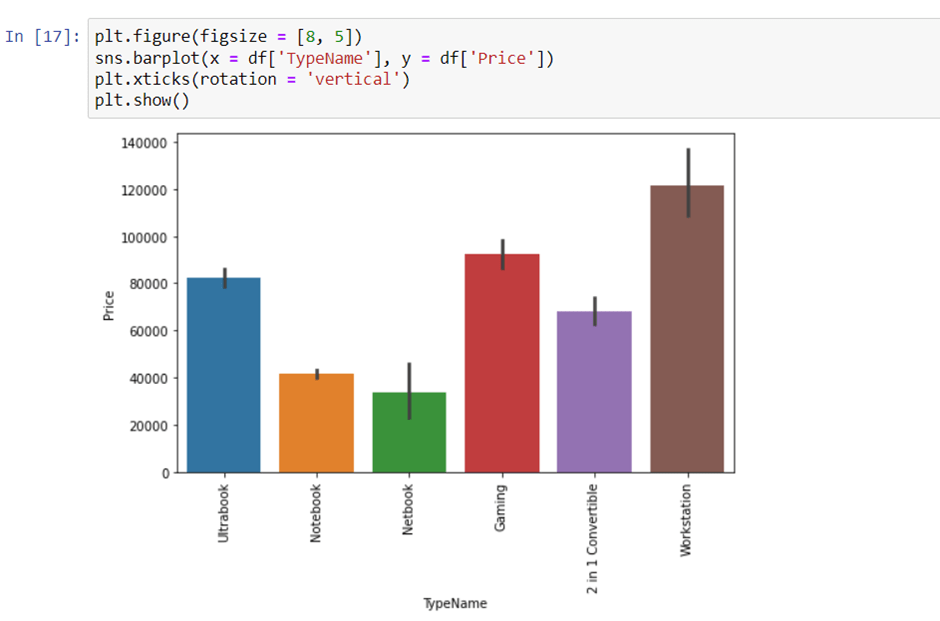
4. Type of laptop
We can check which type of laptop are available like a gaming laptop, workstation, or notebook. As major people prefer notebook because it is under budget range and the same can be concluded from our data.
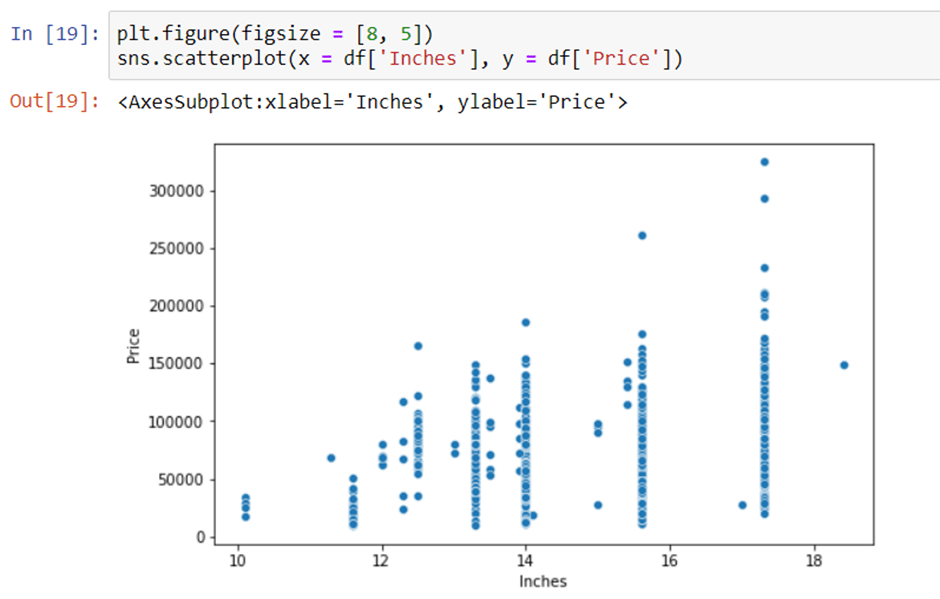
5. Does the price vary with laptop size in inches?
A Scatter plot is used when both the columns are numerical and it answers our question in a better way. From the below plot we can conclude that there is a relationship but not a strong relationship between the price and size column.

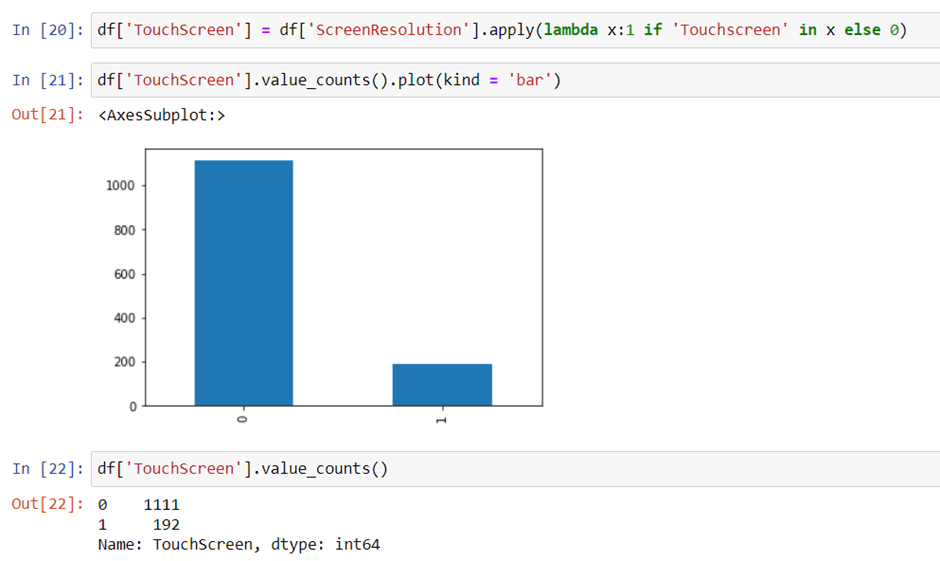
6. Screen Resolution
Screen resolution contains lots of information. before any analysis first, we need to perform feature engineering over it. If you observe unique values of the column then we can see that all value gives information related to the presence of an IPS panel, are a laptop touch screen or not, and the X-axis and Y-axis screen resolution. So, we will extract the column into 3 new columns in the dataset.
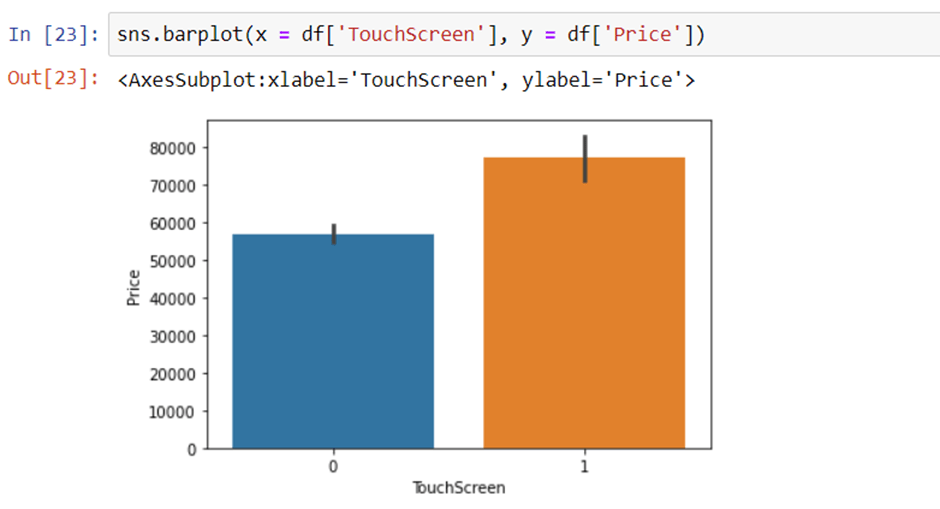
Extract Touch screen information
It is a binary variable so we can encode it as 0 and 1. one means the laptop is a touch screen and zero indicates not a touch screen.
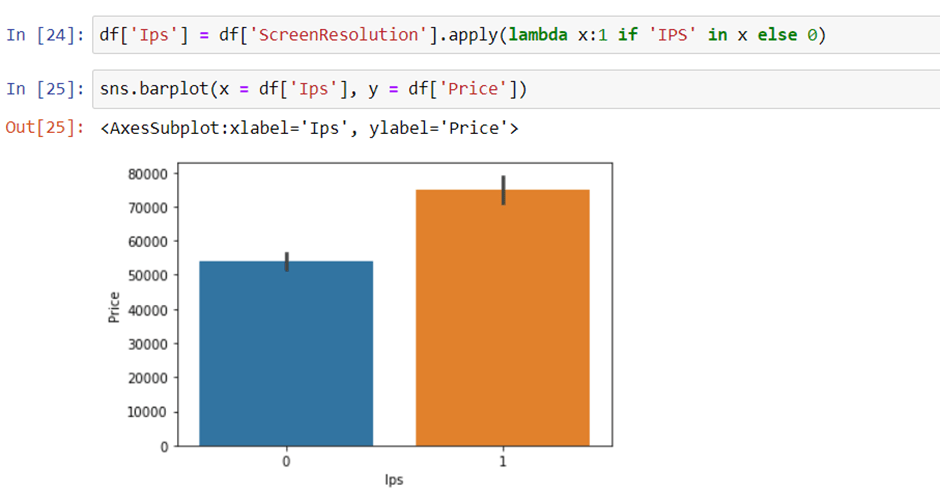
Extract IPS Channel presence information
It is a binary variable and the code is the same we used above. The laptops with IPS channel are present less in our data but by observing relationship against the price of IPS channel laptops are high.
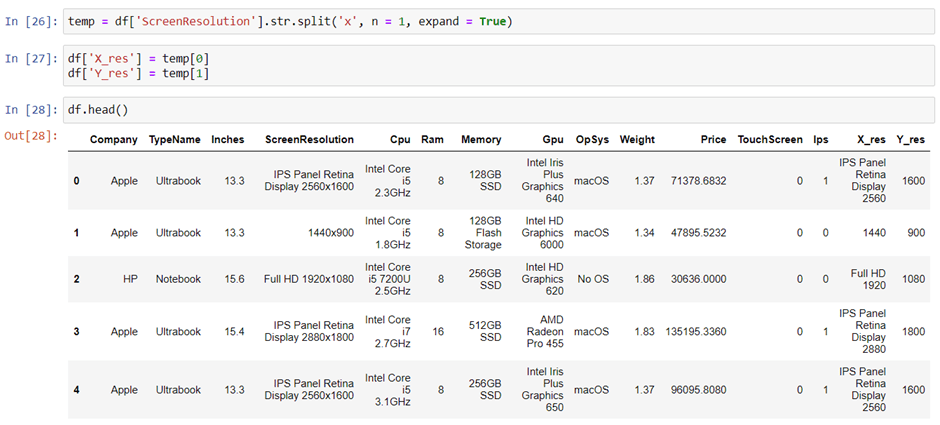
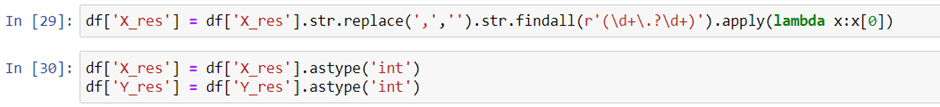
Extract X-axis and Y-axis screen resolution dimensions
Now both the dimension are present at end of a string and separated with a cross sign. So first we will split the string with space and access the last string from the list. then split the string with a cross sign and access the zero and first index for X and Y-axis dimensions.
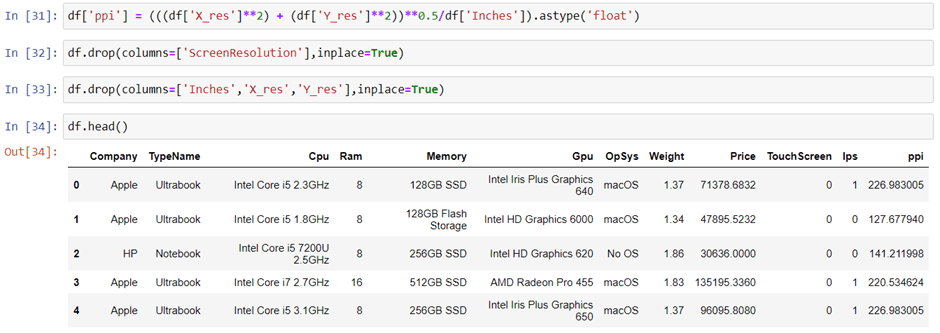
Replacing inches, X and Y resolution to PPI
If you find the correlation of columns with price using the corr method then we can see that inches do not have a strong correlation but X and Y-axis resolution have a very strong resolution so we can take advantage of it and convert these three columns to a single column that is known as Pixel per inches(PPI). In the end, our goal is to improve the performance by having fewer features.
So now we can drop the extra columns which are not of use. At this point, we have started keeping the important columns in our dataset
7. CPU column
If you observe the CPU column then it also contains lots of information. If you again use a unique function or value counts function on the CPU column then we have 118 different categories. The information it gives is about preprocessors in laptops and speed.
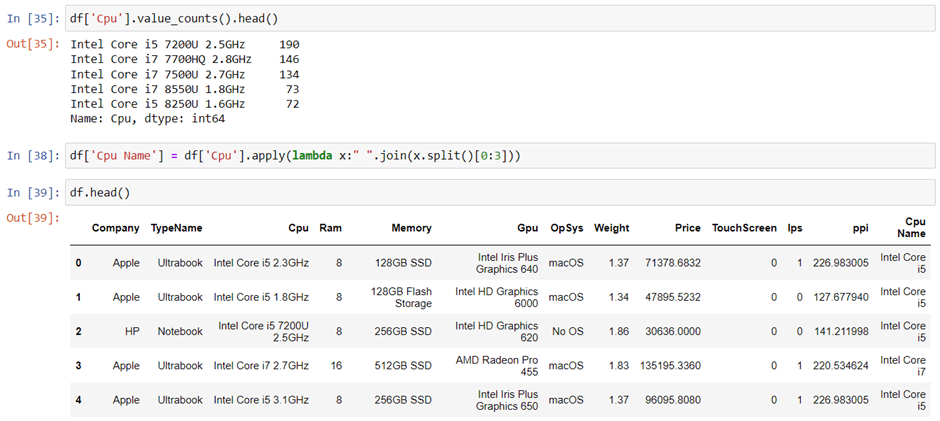
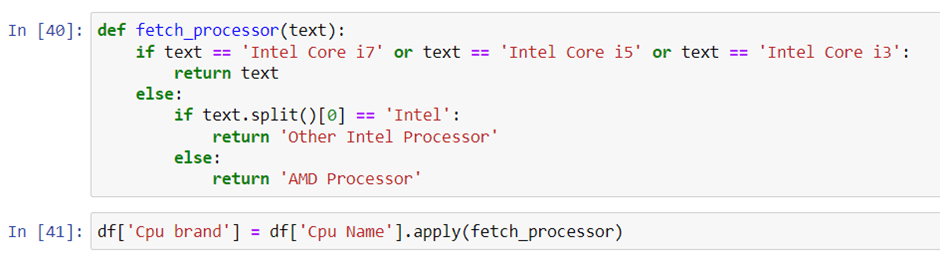
To extract the preprocessor we need to extract the first three words from the string. we are having an Intel preprocessor and AMD preprocessor so we are keeping 5 categories in our dataset as i3, i5, i7, other intel processors, and AMD processors.
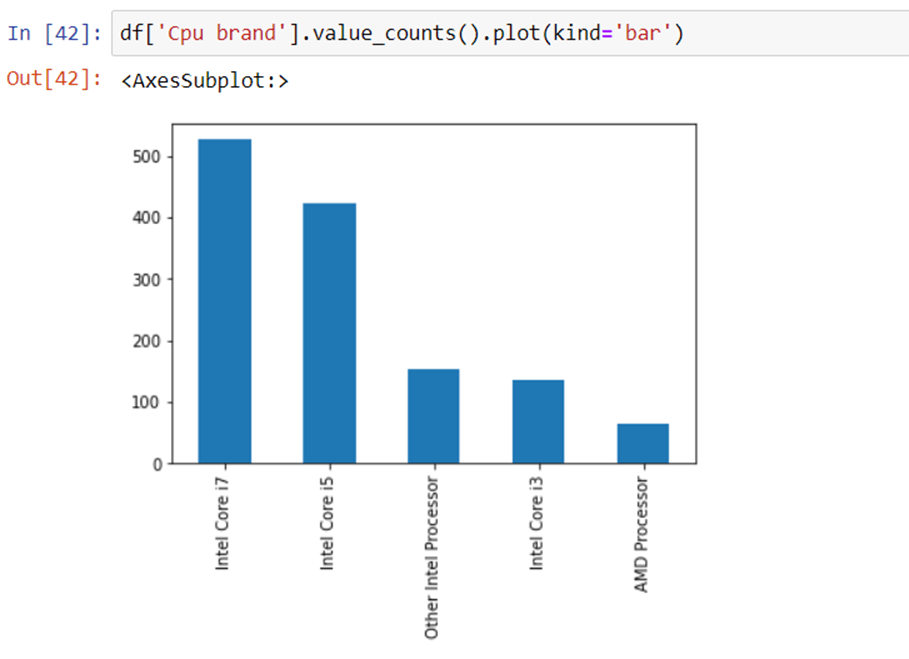
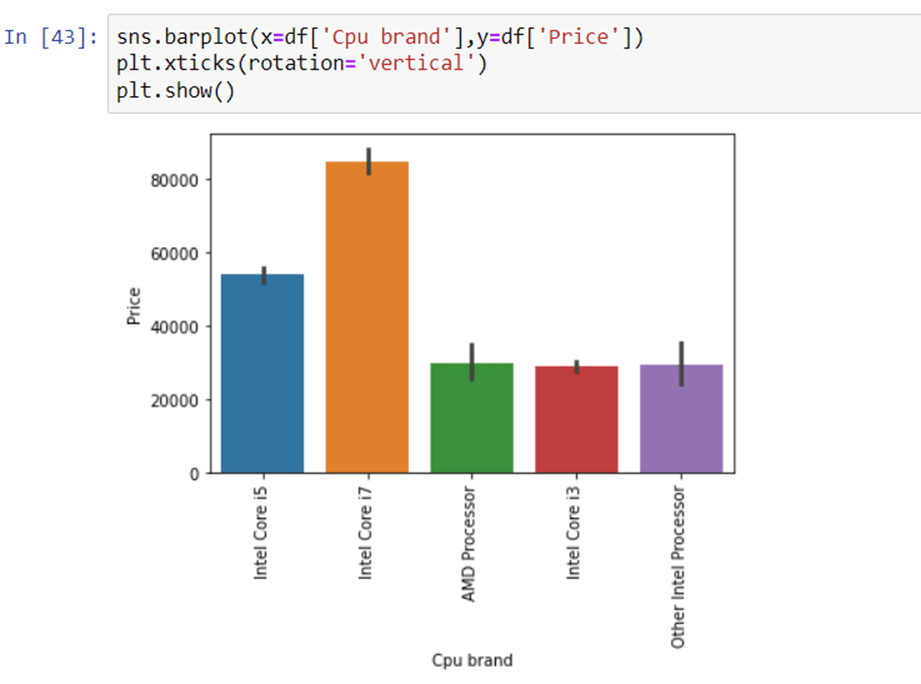
How does the price vary with processors?
we can again use our bar plot property to answer this question. And as obvious the price of i7 processor is high, then of i5 processor, i3 and AMD processor lies at the almost the same range. Hence price will depend on the preprocessor.
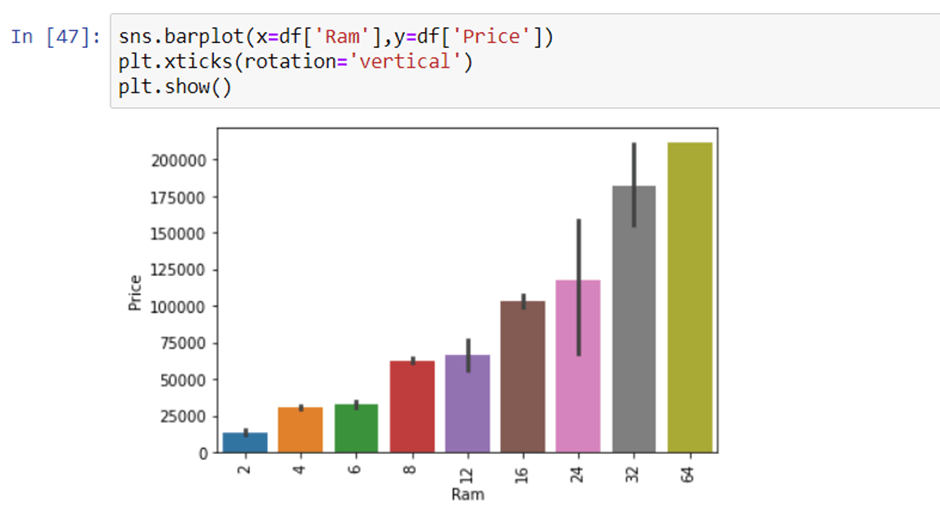
8. Price with Ram
Again Bivariate analysis of price with Ram. If you observe the plot then Price is having a very strong positive correlation with Ram or you can say a linear relationship.
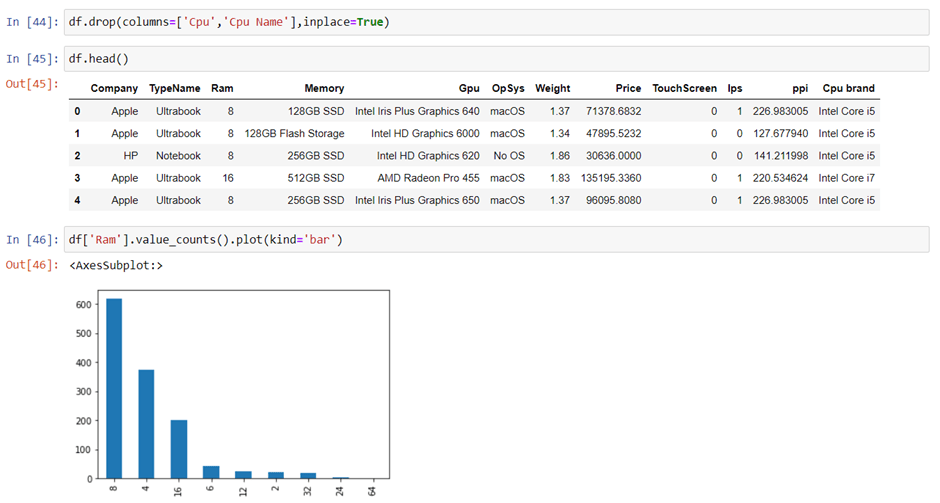
9. Memory column
Memory column is again a noisy column that gives an understanding of hard drives. many laptops came with HHD and SSD both, as well in some there is an external slot present to insert after purchase. This column can disturb your analysis if not feature engineer it properly. So If you use value counts on a column then we are having 4 different categories of memory as HHD, SSD, Flash storage, and hybrid.

First, we have cleaned the memory column and then made 4 new columns which are a binary column where each column contains 1 and 0 indicate that amount four is present and which is not present. Any laptop has a single type of memory or a combination of two. so in the first column, it consists of the first memory size and if the second slot is present in the laptop then the second column contains it else we fill the null values with zero. After that in a particular column, we have multiplied the values by their binary value. It means that if in any laptop particular memory is present then it contains binary value as one and the first value will be multiplied by it, and same with the second combination. For the laptop which does have a second slot, the value will be zero multiplied by zero is zero.
Now when we see the correlation of price then Hybrid and flash storage have very less or no correlation with a price. We will drop this column with CPU and memory which is no longer required.

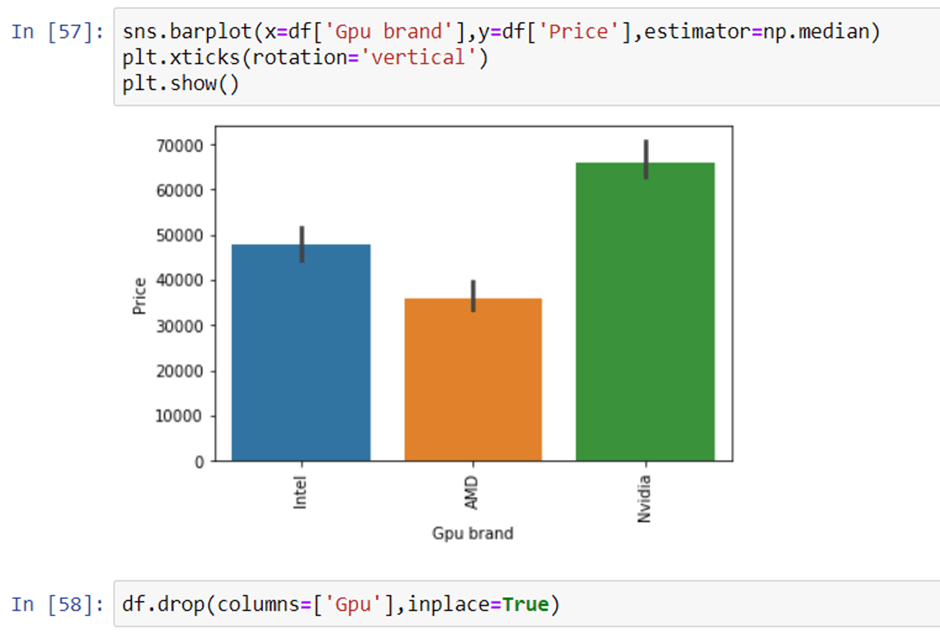
10. GPU Variable
GPU(Graphical Processing Unit) has many categories in data. We are having which brand graphic card is there on a laptop. we are not having how many capacities like (6Gb, 12 Gb) graphic card is present. so we will simply extract the name of the brand.
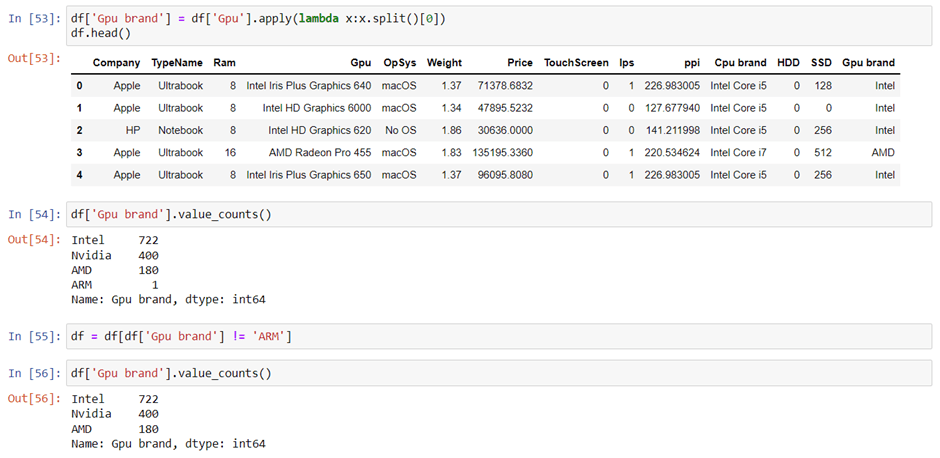
If you use the value counts function then there is a row with GPU of ARM so we have removed that row and after extracting the brand GPU column is no longer needed.
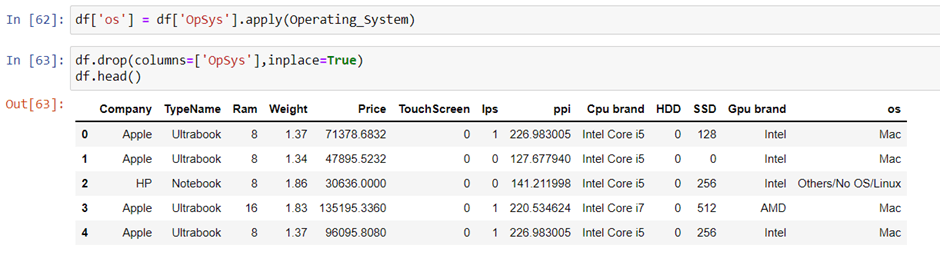
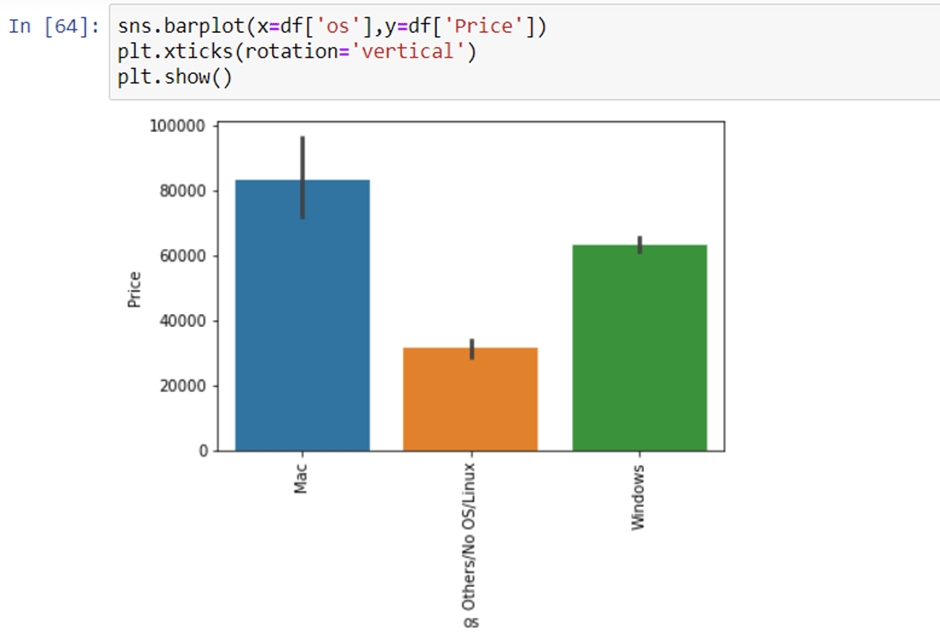
11. Operating System Column
There are many categories of operating systems. we will keep all windows categories in one, Mac in one, and remaining in others. This is a simple and most used feature engineering method you can try something else if you find more correlation with price. Also, after this we will drop the OpSys column.


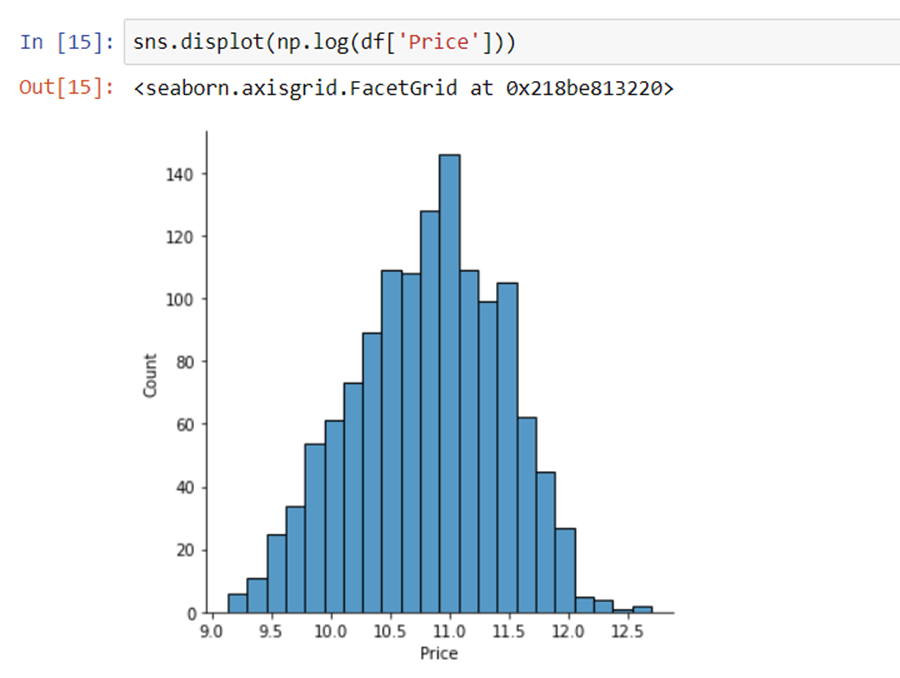
Log-Normal Transformation
we saw the distribution of the target variable above which was right-skewed. By transforming it to normal distribution performance of the algorithm will increase. we take the log of values that transform to the normal distribution which you can observe below. So, while separating dependent and independent variables we will take a log of price, and in displaying the result perform exponent of it.
Modelling
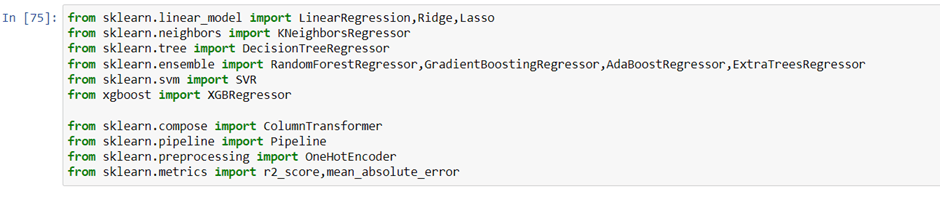
we have imported libraries to split data, and algorithms you can try. At a time we do not know which is best so you can try all the imported algorithms.
Split in train and test test
As discussed we have taken the log of the dependent variables. And the training data looks something below the dataframe.

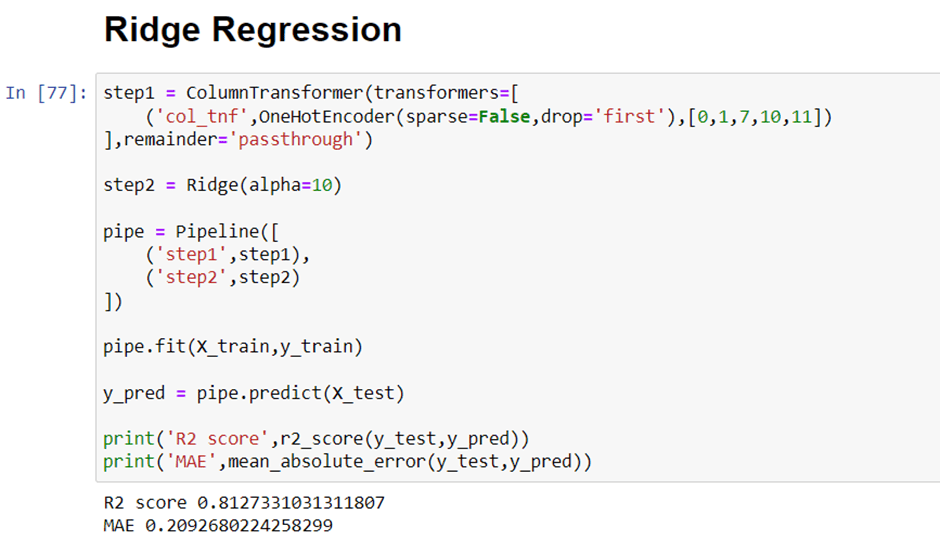
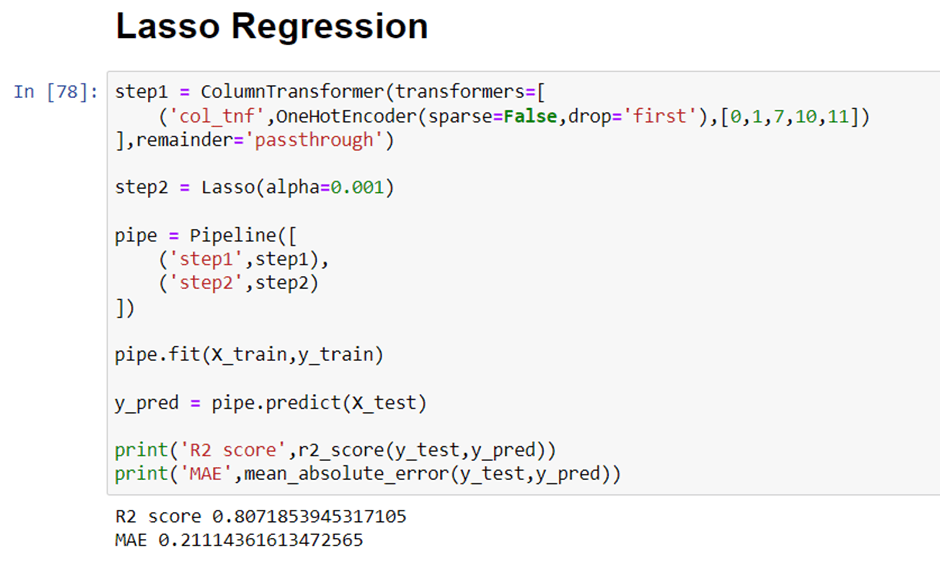
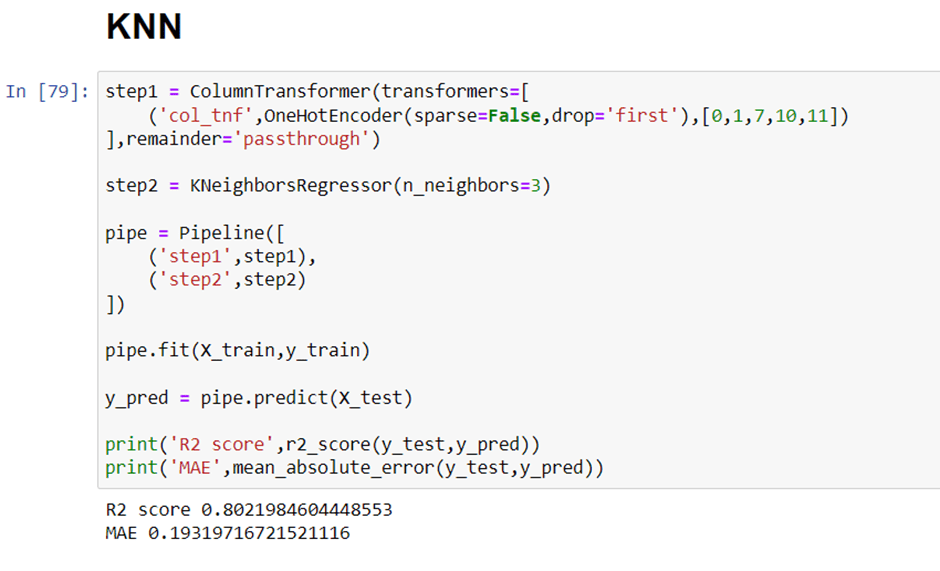
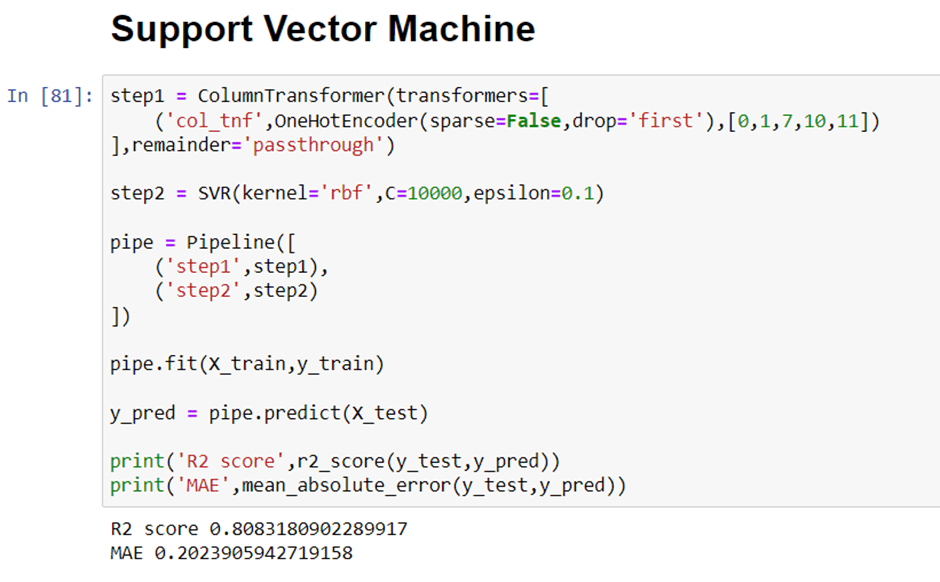
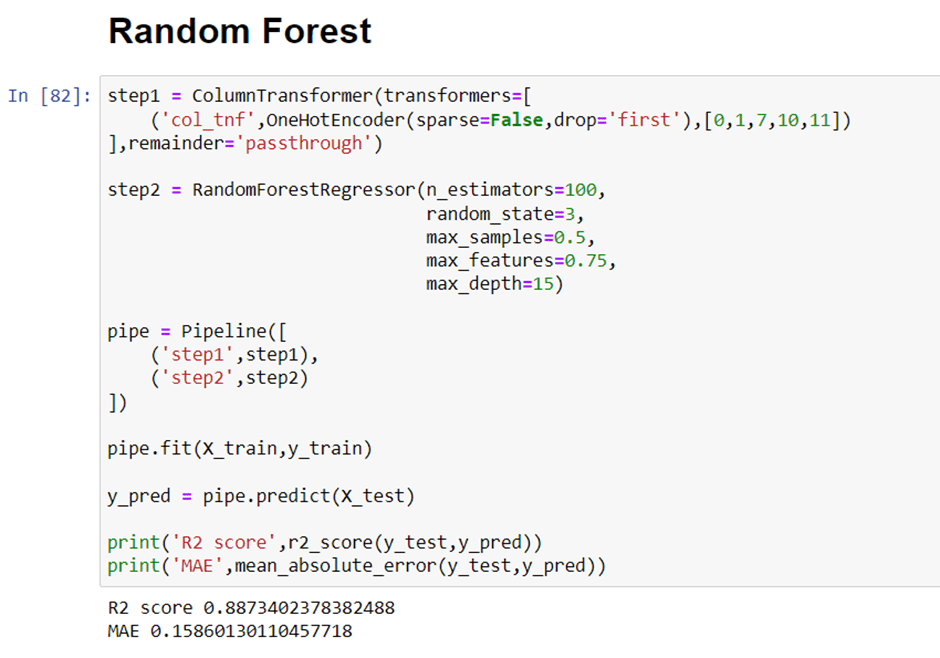
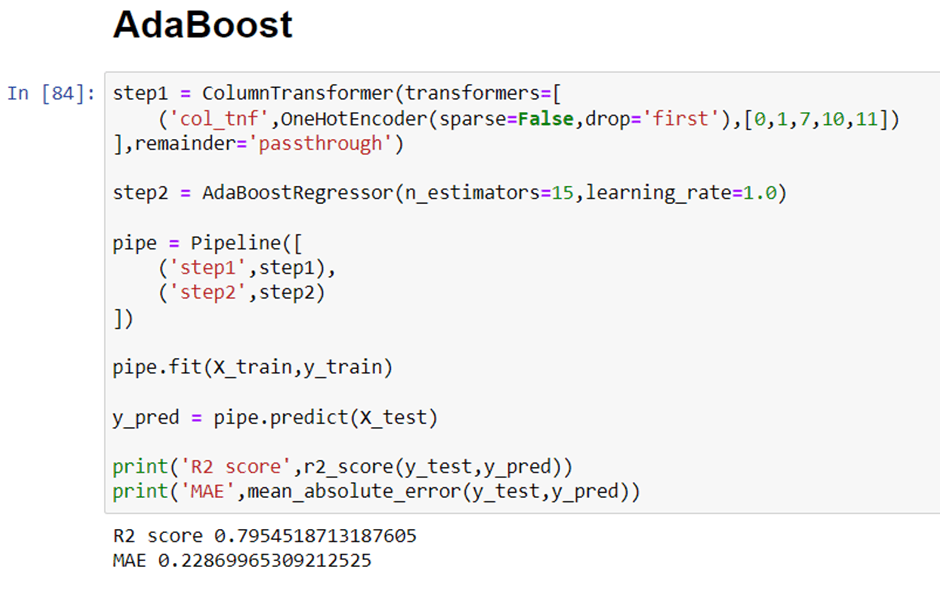
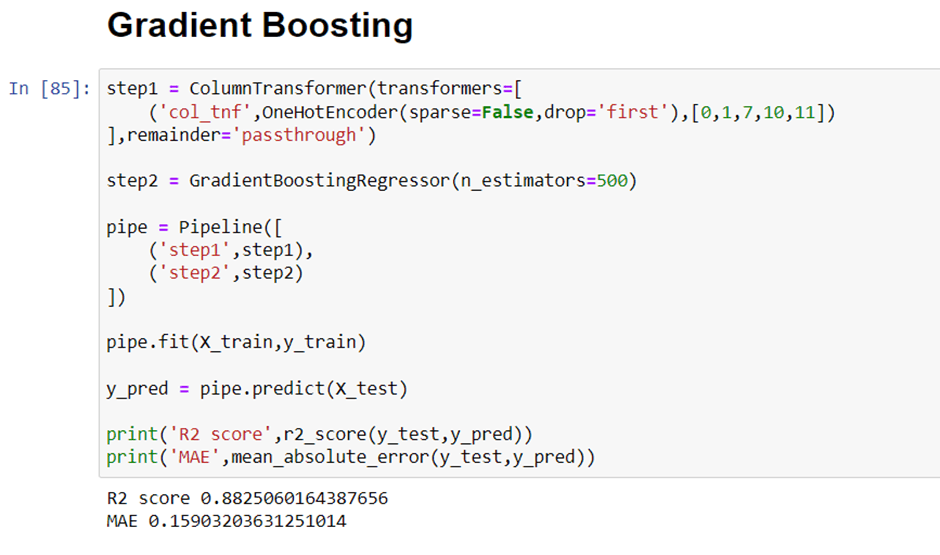
Implement Pipeline for training and testing
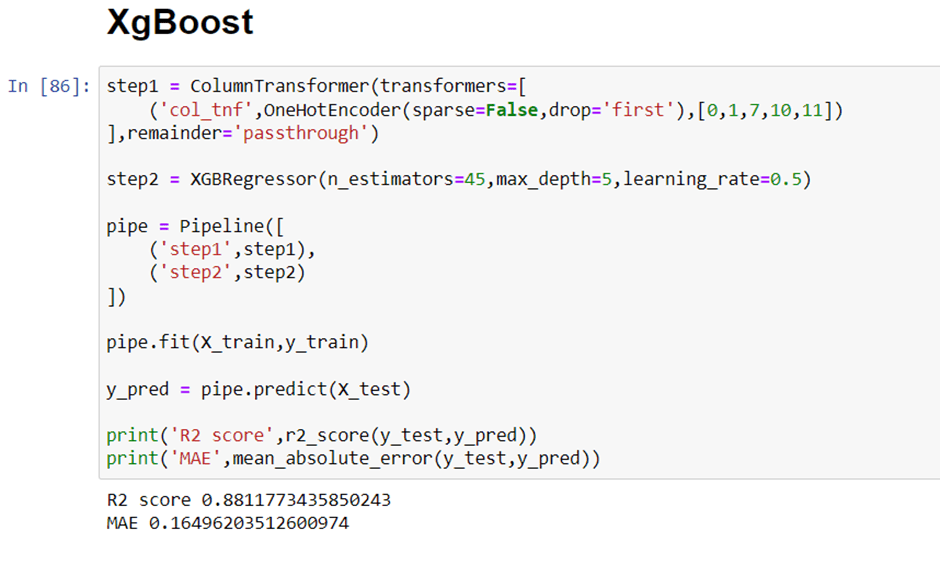
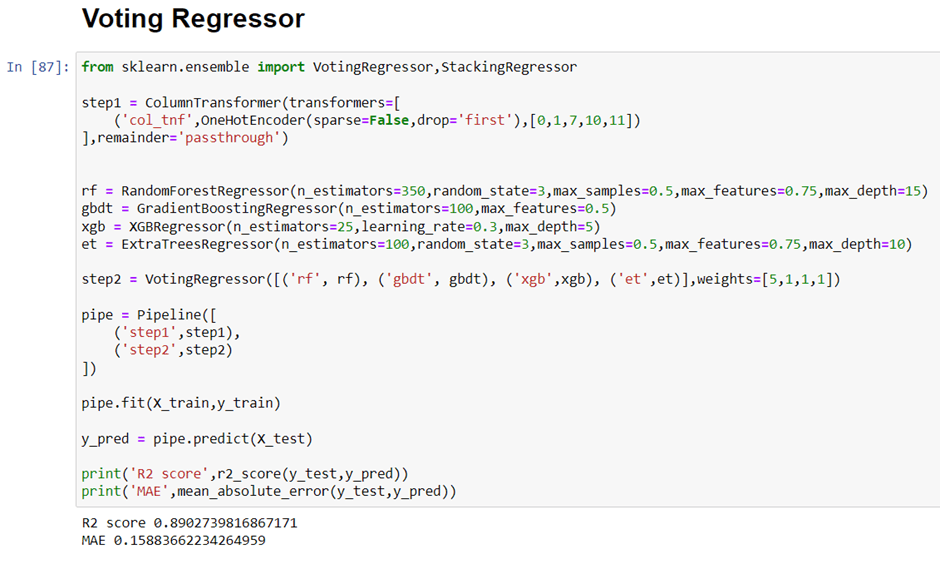
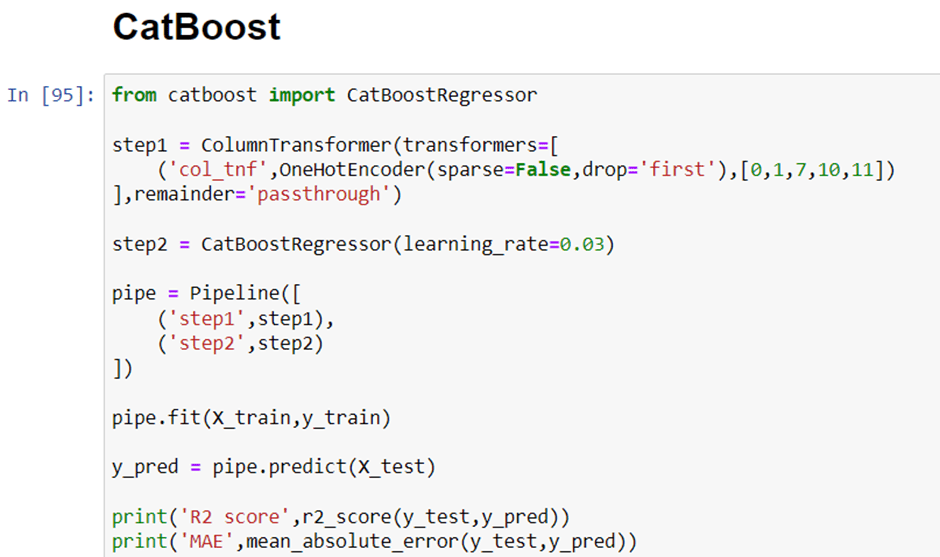
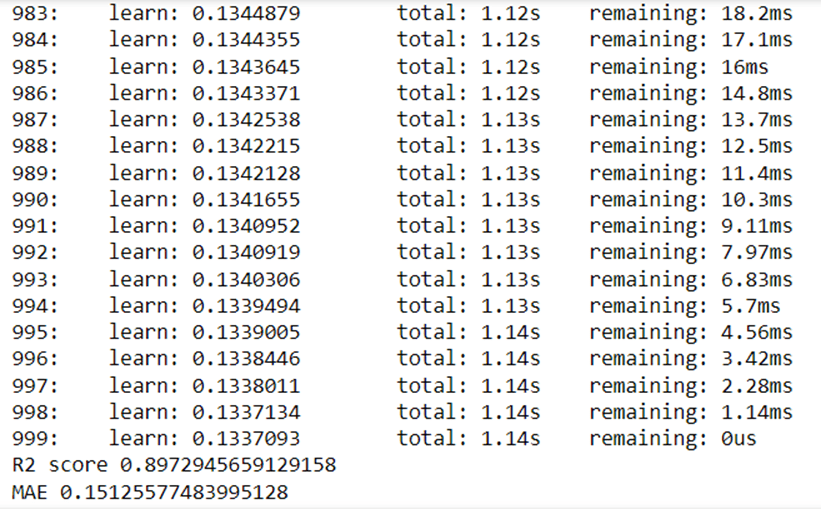
Now we will implement a pipeline to streamline the training and testing process. first, we use a column transformer to encode categorical variables which is step one. After that, we create an object of our algorithm and pass both steps to the pipeline. using pipeline objects we predict the score on new data and display the accuracy.
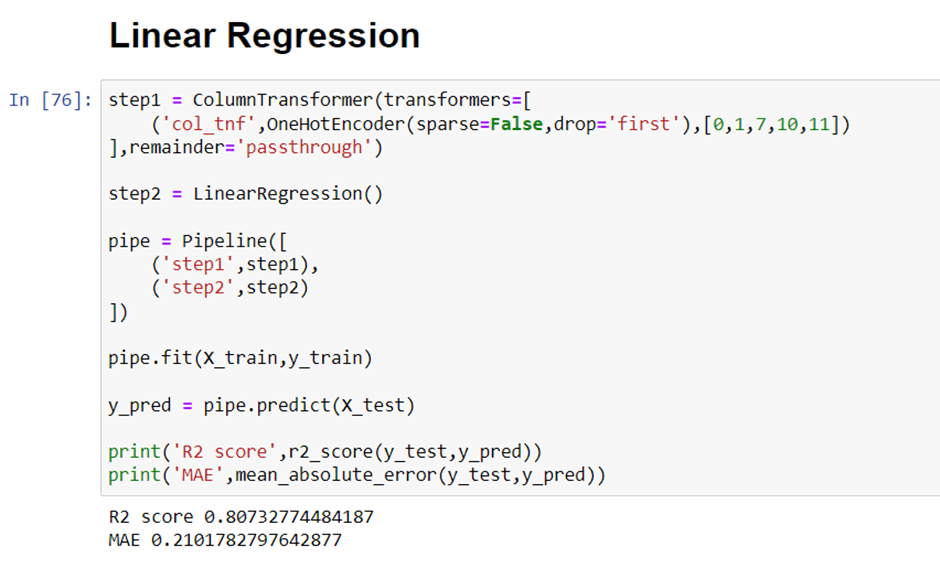
In the first step for categorical encoding, we passed the index of columns to encode, and pass-through means pass the other numeric columns as it is. The best accuracy I got is with all-time catboost. But you can use this code again by changing the algorithm and its parameters.


Exporting the Model
Now we have done with modeling. we will save the pipeline object for the development of the project website. we will also export the data frame which will be required to create dropdowns in the website.

Create Web Application for Deployment of Laptop Price Prediction Model
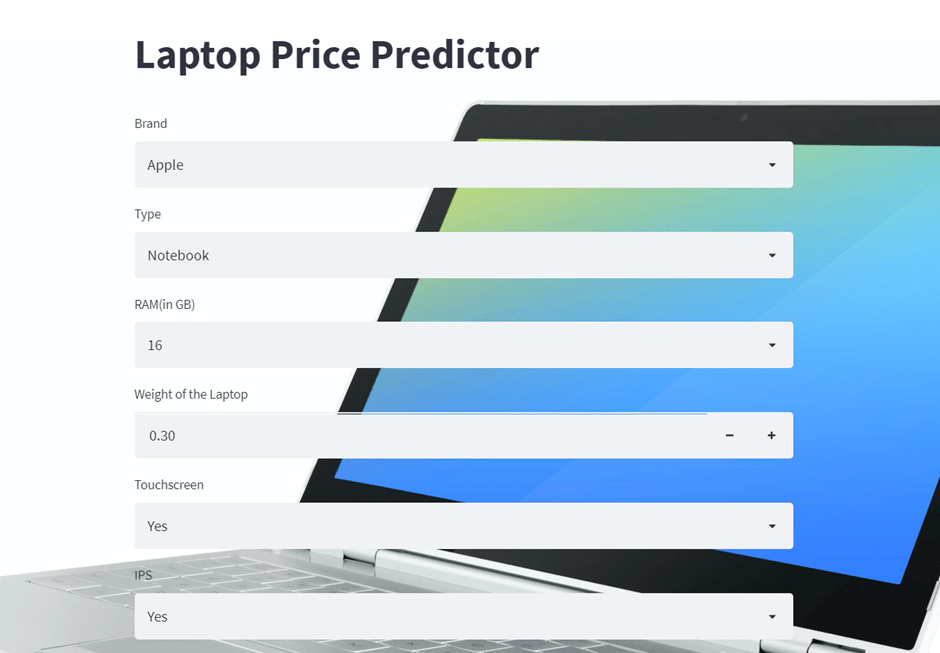
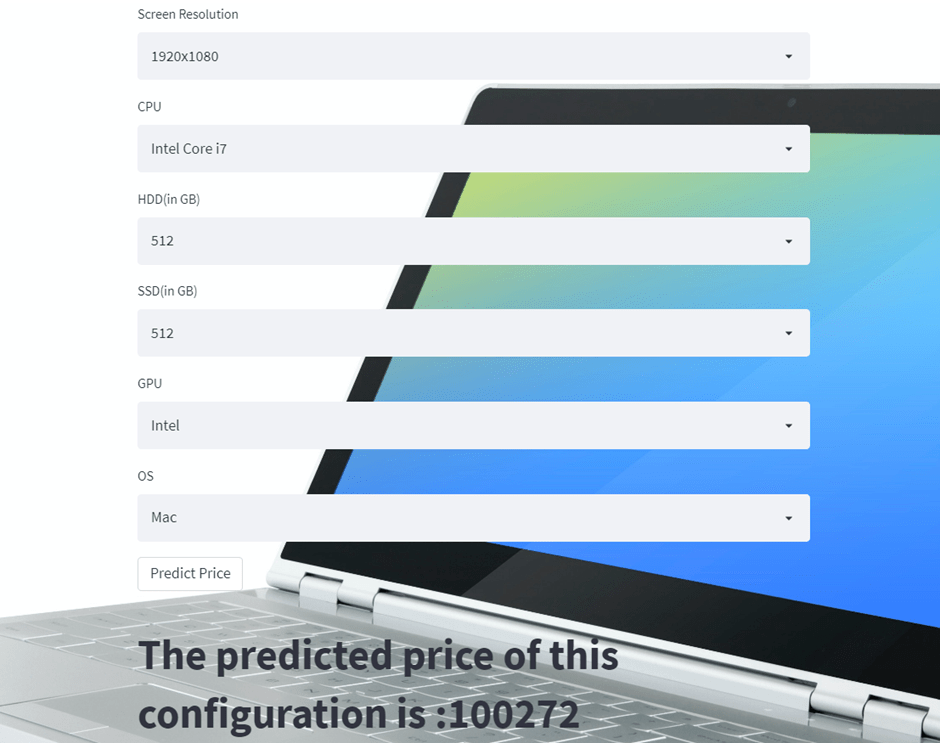
Now we will use streamlit to create a web app to predict laptop prices. In a web application, we need to implement a form that takes all the inputs from users that we have used in a dataset, and by using the dumped model we predict the output and display it to a user.
Streamlit
Streamlit is an open-source web framework written in Python. It is the fastest way to create data apps and it is widely used by data science practitioners to deploy machine learning models. To work with this it is not important to have any knowledge of frontend languages.
Our laptop price prediction streamlit webapp would look like this.