Uber is a company based in San Francisco that handles over 118 million users and 5 million drivers, making it the perfect app for you to hire a ride. Additionally, they process an average of 17.4 million trips with over 6 billion rides completed every day.
You can download the dataset used in this project by clicking here

Firtly, we will import the necessary libraries like pandas, numpy, matplotlib, seaborn.

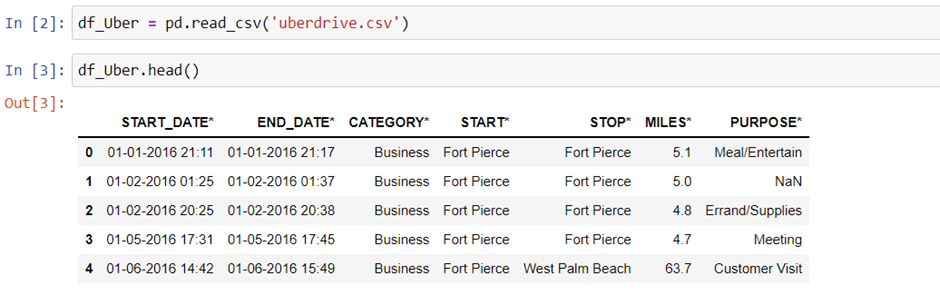
Now, we will read the dataset by using read_csv() method and show the top 5 rows using head() function, also we will look at last 10 rows with the help of tail() function.

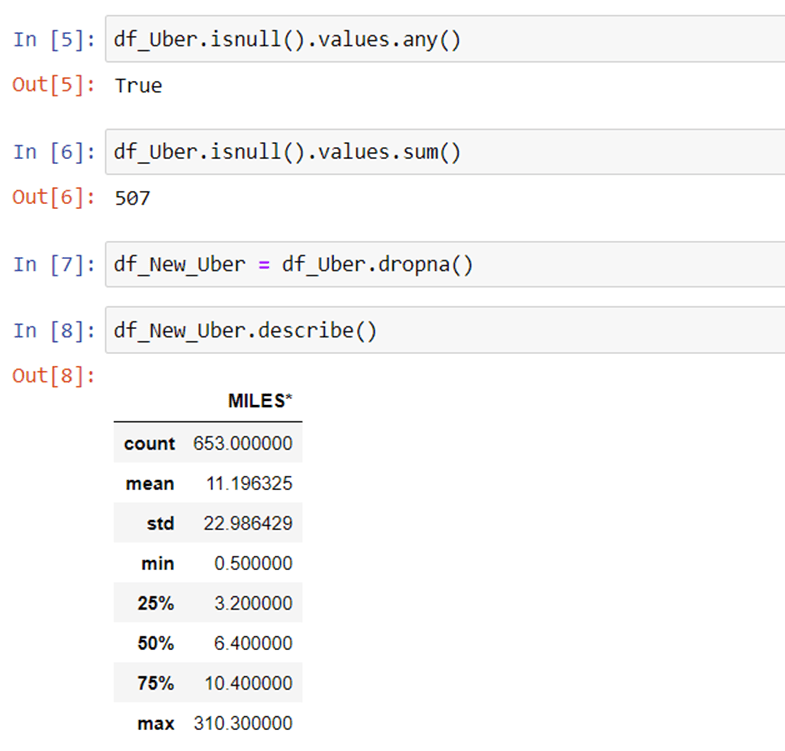
Now, we will check the missing values in our dataset using isnull().values.any() function and count the no. of missing values and drop them with the dropna() function, then we will look at the summary of data by using describe() function.
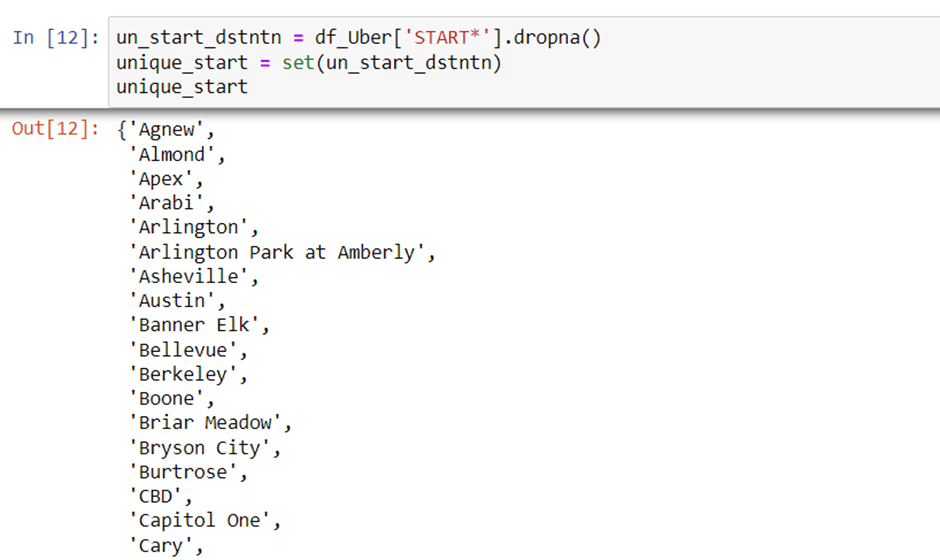
Now, we will check the unique start destination.
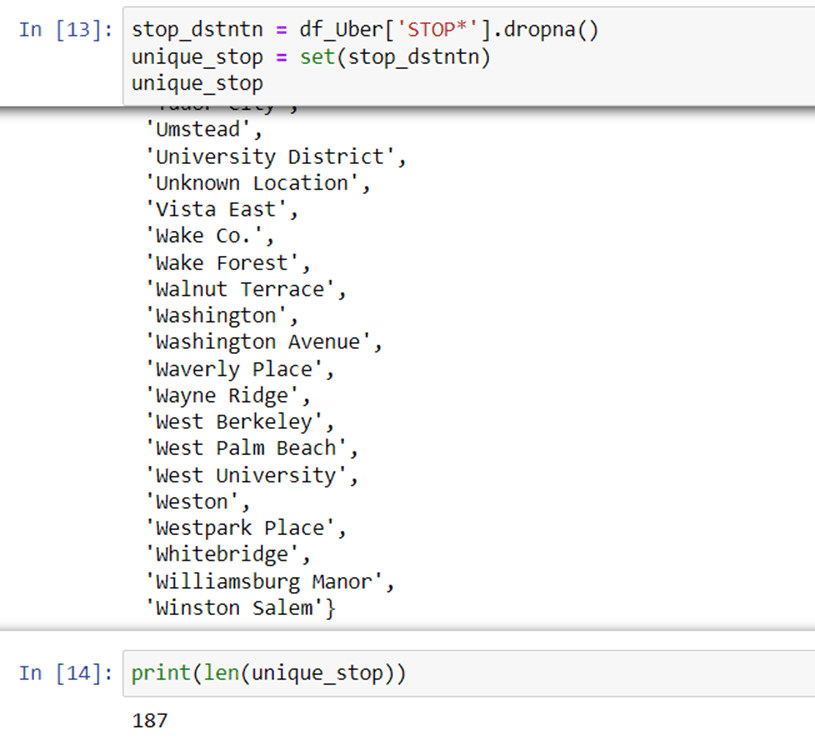
Now, we will check the unique stop destination and to check total number of locations we will apply len() function.
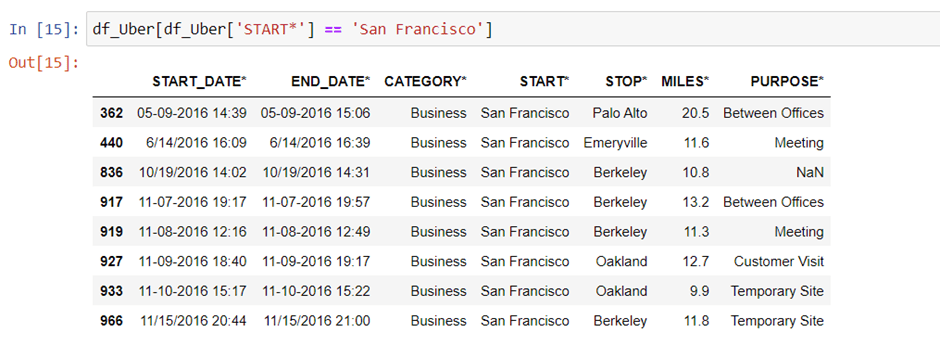
Now, we will check the uber trip which has the starting point of San Francisco.
Here, we will see what is the most popular starting point of uber drivers.

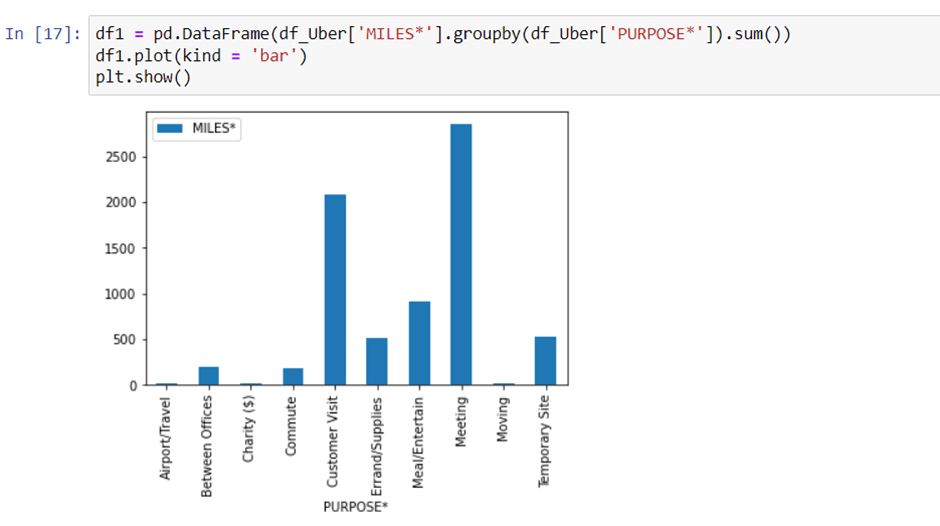
We will plot the bar graph of purpose vs miles.
Plot the bar graph of number of trips vs category of trips.
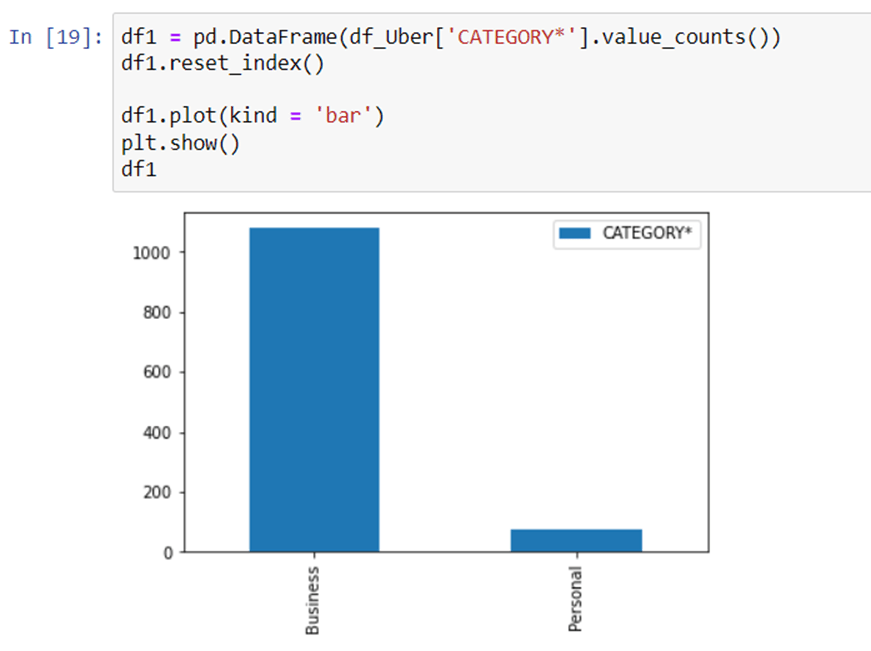
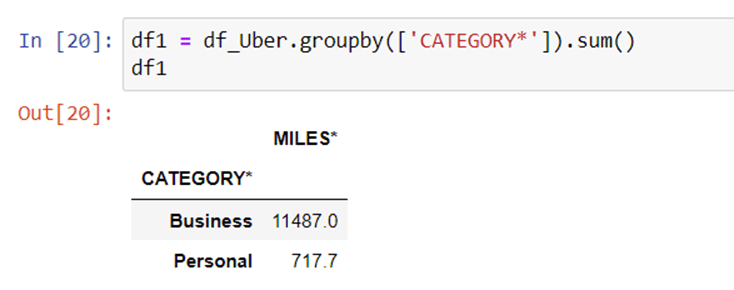
Now we will see what is no. of trips that is business and what is the no. of trips that is personal.