Image Processing is used to perform some operations on images in order to animate them, develop videos, or generate graphics. To get started with data analysis, you can use image preprocessing feature engineering. It’s not difficult to extract useful information from images – this is accomplished via image processing methods. Reduction of noise, adjustment of brightness and color contrast are some examples of desired manipulations.
OpenCV is a computer vision library that’s being used by companies and individuals to develop high-tech technologies. It was first created in C/C++ but has since become popular in the Python programming language for practical computer vision projects. First things first, let’s set up a proper environment for using OpenCV.
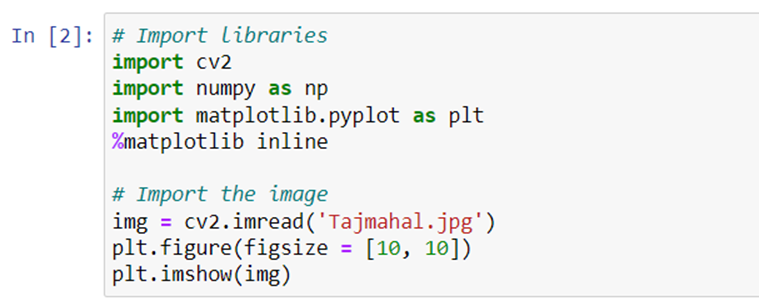
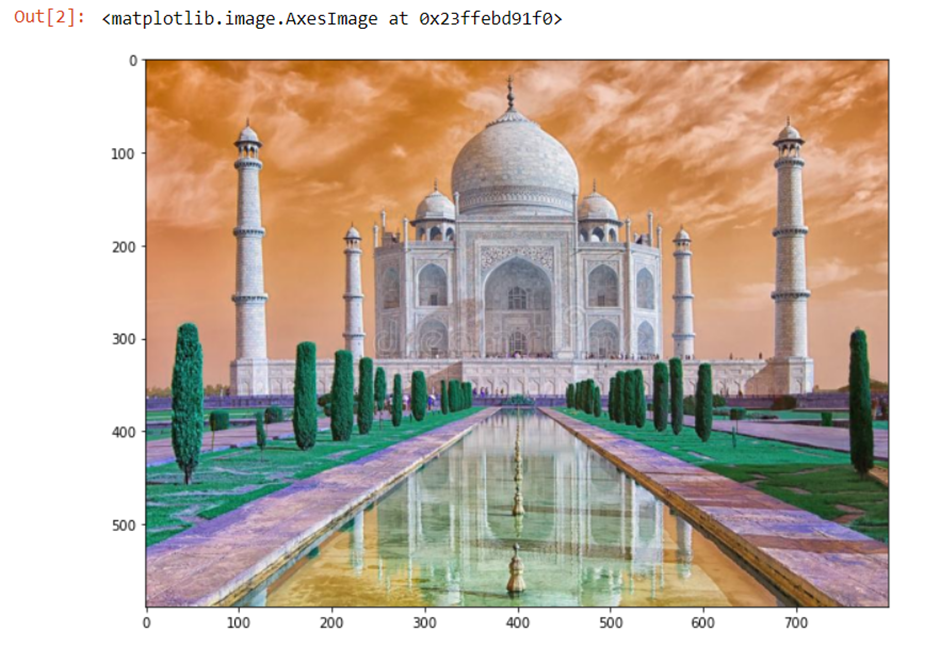
The first step we’re going to do with OpenCV is importing an image and it can be done as follows.
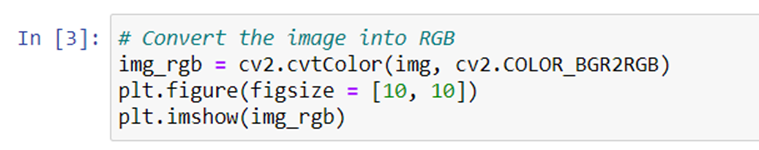
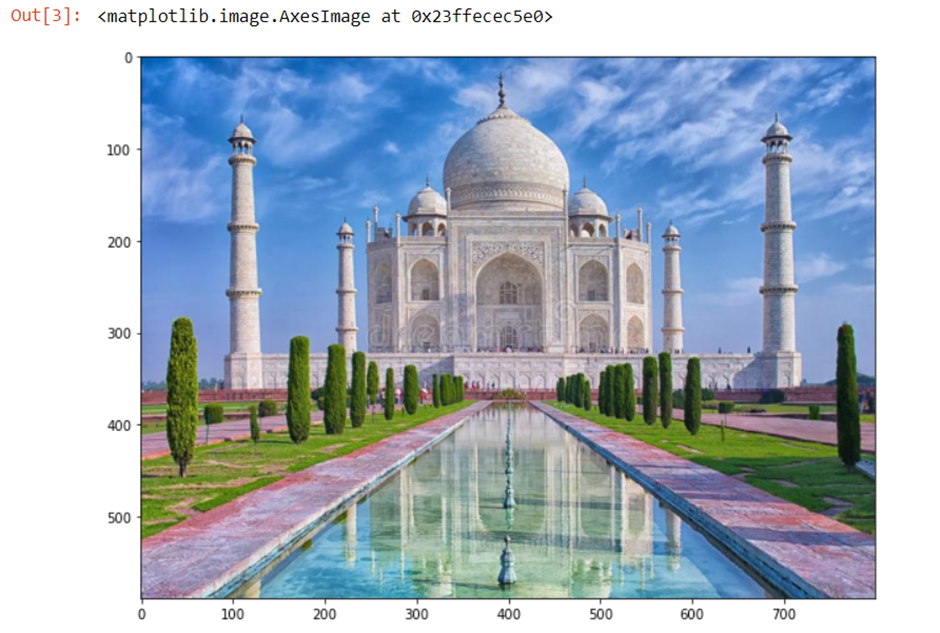
you’d probably notice there’s something different in this picture and it is happening because the default setting of the color mode in OpenCV comes in the order of BGR, which is different from that of Matplotlib. Therefore, to see the image in RGB mode, we need to convert it from BGR to RGB as follows.
More than just RGB
This article gives a lot of info on different color models and how there are two types: the additive color model and the subtractive color model. Improvements in screen technology have led to an increase in the use of additive models. In order to create images, light must be projected through a 3D model, which can result in the text appearing on all sides. However, there are still times when it is appropriate to use a subtractive model. With this method, different layers of ink is used to create the appearance of The colors on an image are made up of primary colors. When these colors are assigned to CMYK and RGB, the final result can vary.
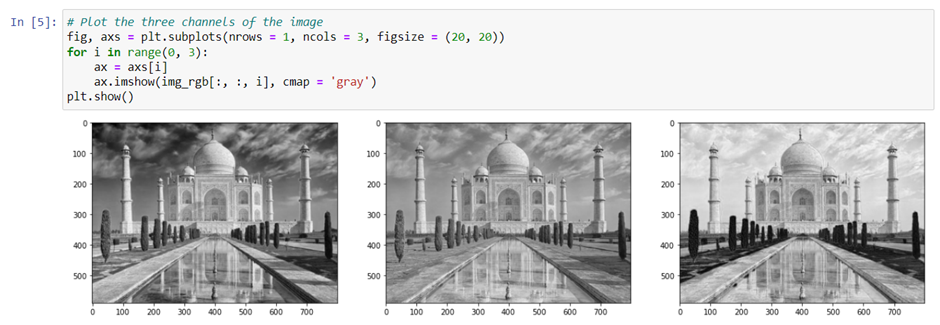
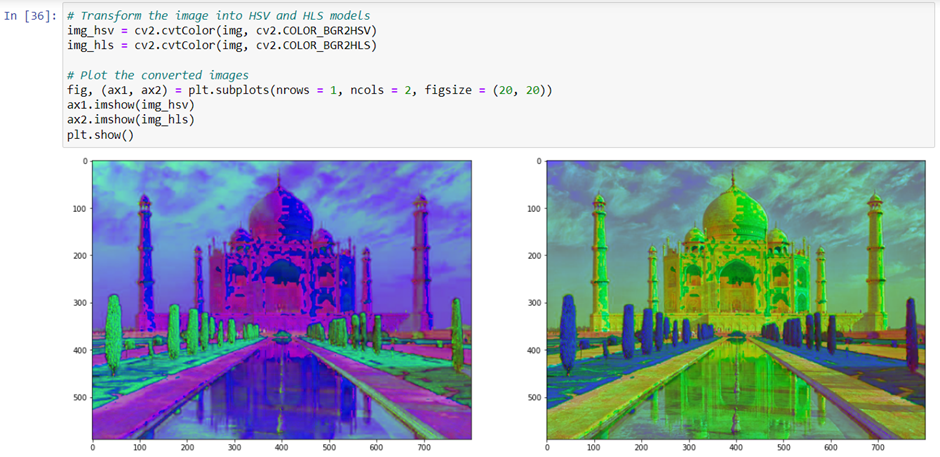
You’ve probably seen HSV & HLS colors (the two most common kinds) in computer vision. But there are more than just two types, and among them are grayscale, hue angles and luminance. Make sure to know how these models work before you start coding an algorithm into your neural network!
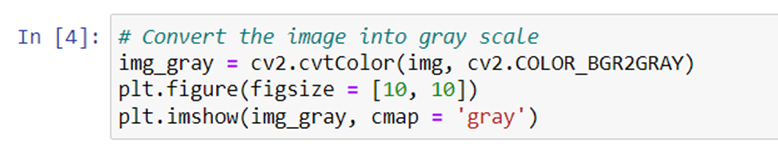
A gray-scale image is a single-channel image. To see images in grayscale, you need to convert from color mode to gray. This requires white and black values of integer values between 0 and 255 where 0 is for black and 255 for white.
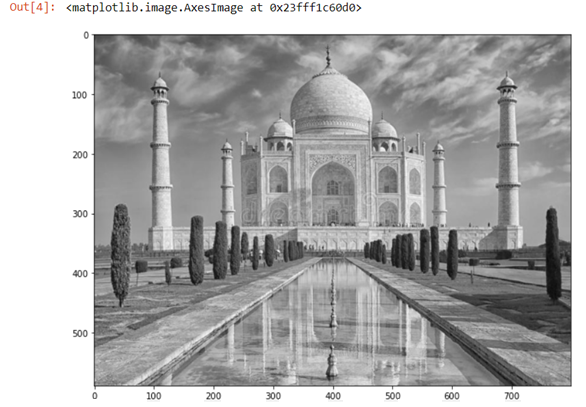
An RGB image is made up of 3 channels: Red, Green, & Blue. If you take each channel and depict them one by one, it’s easy to visualize how the different channels are structured.
Take a look at the images above. The three images show you how each channel is composed of. In the R channel picture, the part with the high saturation of red colors looks white. Why is that? This is because the values in the red color parts will be near 255. And in grayscale mode, the higher the value is, the whiter the color becomes. You can also check this with G or B channels and compare how certain parts differ one from another.
HSV, or hue, saturation and value, is a color encoding used to convey brightness and contrast. The three dimensions of the hue are represented with numbers from 0°-360°. HSV stands for hue, saturation, and lightness. I’m not certain about the center axis for HSV, but the UV (or Value) tells you about colors. The “H” refers to light information and comes from a combination of intensity (the beam of light has a number from 0 in every direction to 360 degrees) with any special information that would affect by changing the saturation of the colors, you can create a whole new color mode. Transforming color mode can be done as follow:
Drawing on images
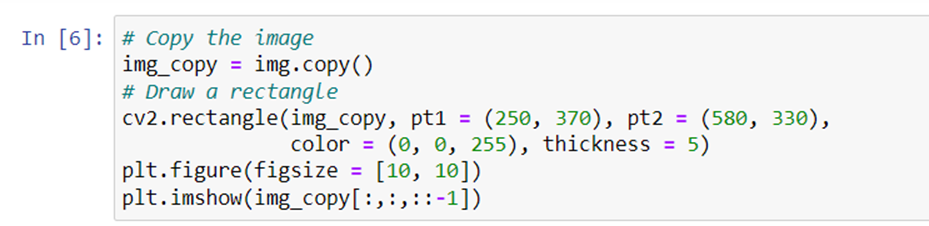
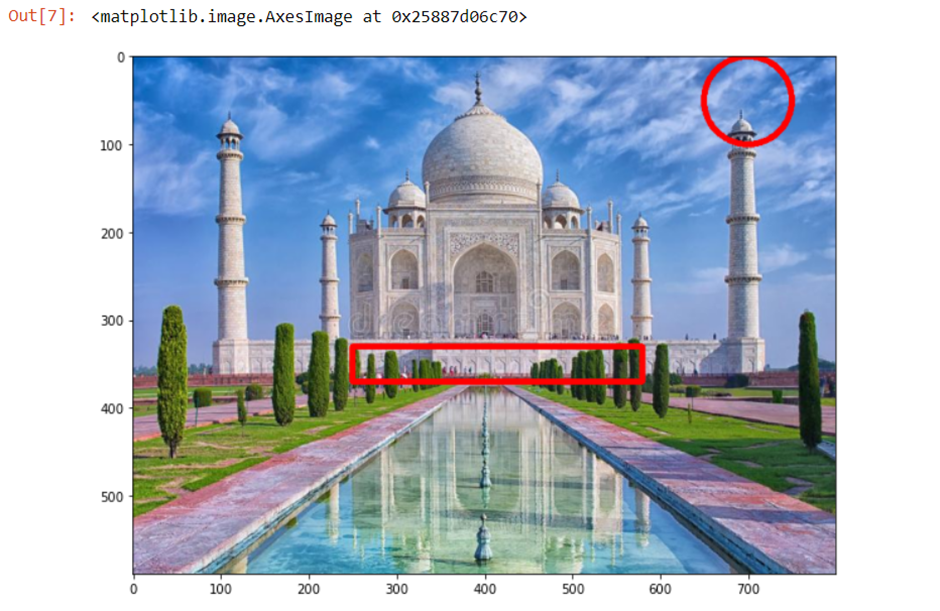
Let’s bring some figures on the image. Now, we are going to draw a rectangle on this image. by using cv2.rectangle() we will draw a rectangle. We need to give the coordinates values for the upper left point and the lower right point.
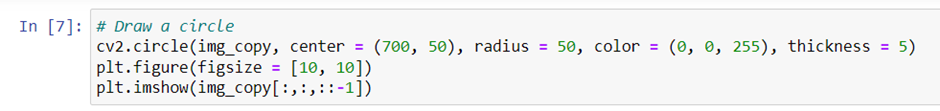
Great! we have successfully drawn rectangle on the image. now, we will try to draw some other shape let’s say ‘circle’. so, I’ll make a circle this time. With cv2.circle(), we need to specify the point of its center and the length of its radius.
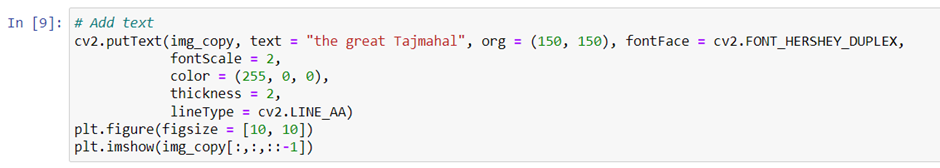
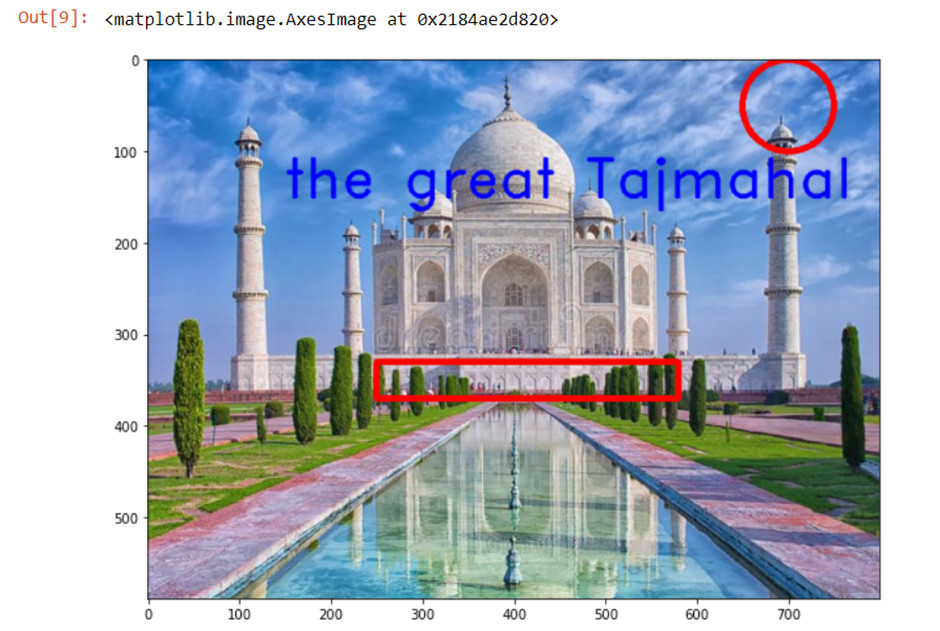
We can also put text data on the image. With cv2.putText(), we can designate the position and the font style and size of the text.
You can also try other functions such as drawing a line or other shapes. Next time, we’re going to talk about more advanced technologies such as attaching two different images, image contour and threshold based methods.
