You may be already familiar with the word ‘contour.’ I’ve used this term several times in previous posts. A contour line is a curved line representing values. It is a very simple type of map that outlines the changes in an area, typically separating the different landforms.
But then you may ask this. The terms ‘edges’ and ‘contours’ are often used interchangeably, which can become confusing. The difference between the two is that edges have sharp angles while contours have curved or jagged lines. Edges are the most local region of a figure while contours are the boundaries of a figure. Edges are points whose values change significantly compared to their neighboring points. Contours, on the other hand, are closed curves which are obtained from edges and depicting a boundary of figures.
Contour detection can be implemented by the function cv2.findContours() in OpenCV and there are two important parameters here. Mode is the way of finding contours, and method is the approximation method for the detection.
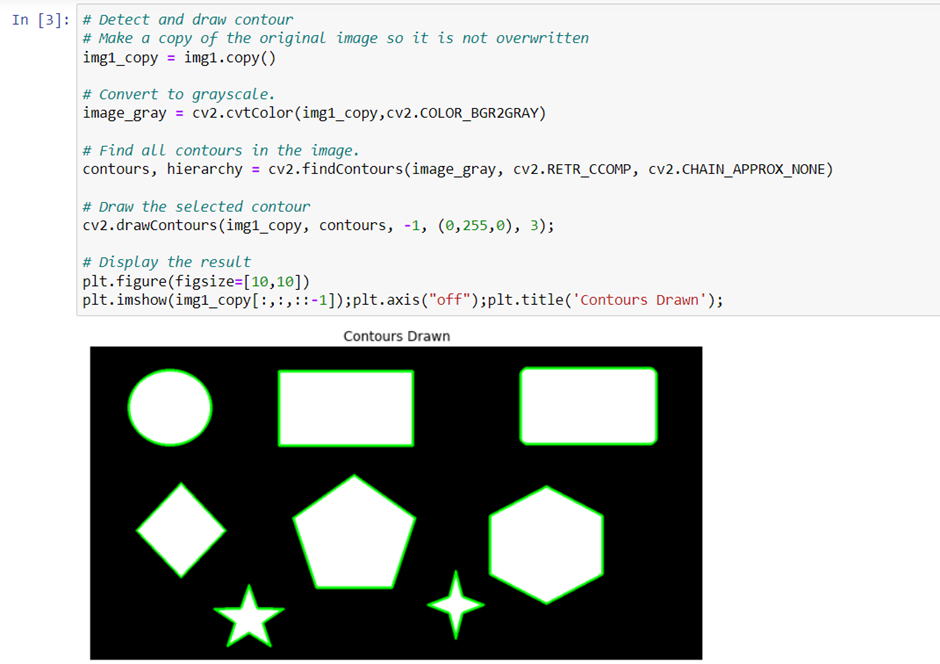
The mode CV_RETR_CCOMP retrieves all of the contours and organizes them into a two-level hierarchy. At the top level, there are external boundaries of the components. At the second level, there are boundaries of the holes. If there is another contour inside a hole of a connected component, it is still put at the top level.
CV_CHAIN_APPROX_NONE stores absolutely all the contour points. That is, any 2 subsequent points (x1, y1) and (x2, y2) of the contour will be either horizontal, vertical or diagonal neighbors, that is, max(abs(x1-x2), abs(y2-y1)) == 1.
The returned contour is a list of points consisting of the contour lines. With the selected contour line, cv2.drawContours() will depict the bounding line along with the points as shown above.
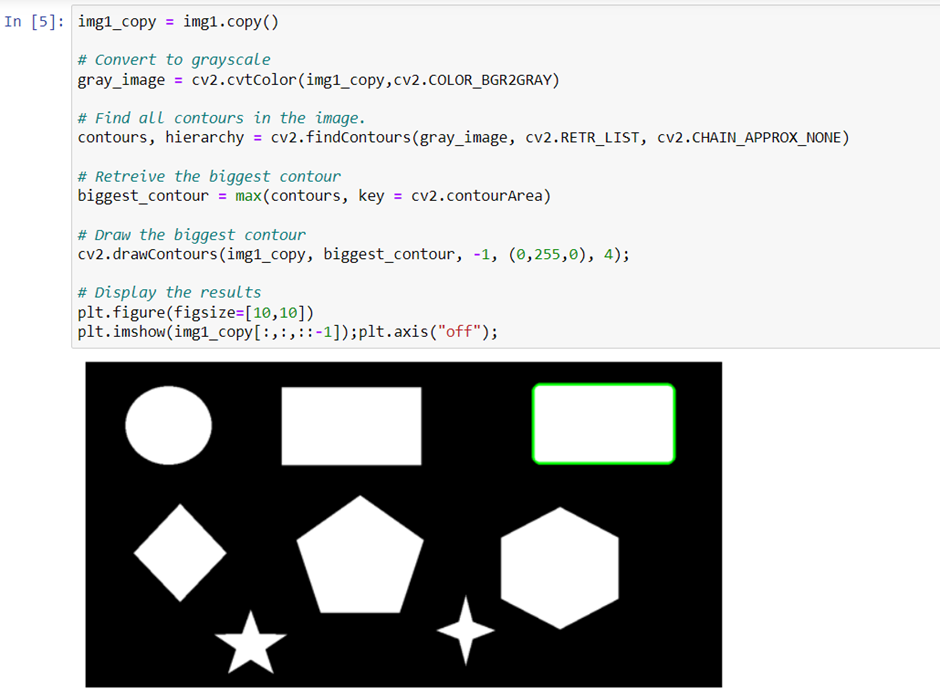
Extracting the Largest Contour in the image
The contours detected are returned as a list of continuous coordinates that form the shape of the object. Using these coordinates and the built-in python’s max() function we can retrieve the largest contour in the list. The max() function takes in as input the contours list along with a key parameter which refers to the single argument function used to customize the sort order. The function is applied to each item on the iterable. For retrieving the largest contour we use the key cv2.contourArea which is a function that returns the area of a contour. It is applied to each contour in the list and then the max() function returns the largest contour based on its area.
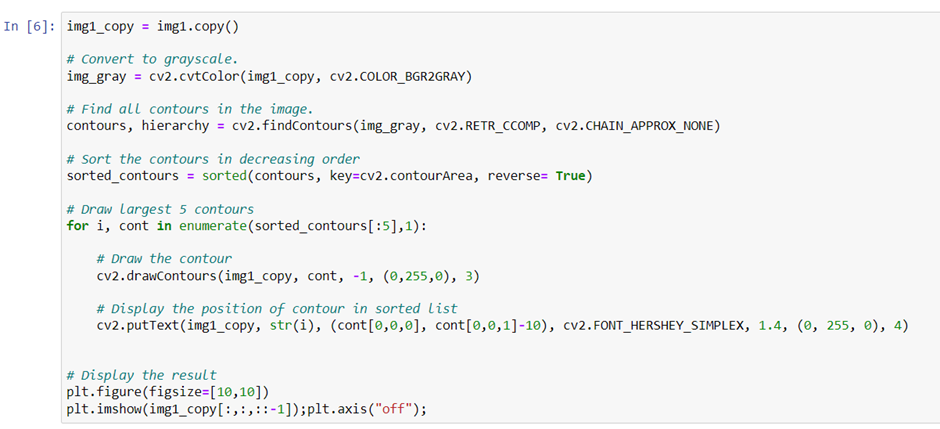
Sorting Contours in terms of size
The max() function will only return the largest contour in the list. To compare all of the contours in the list another built-in python function sorted() can be used. sorted() function also takes in the optional key parameter which we use as before for returning the area of each contour. Then the contours are sorted based on area and the resultant list is returned. We also specify the order of sort reverse = True i.e in descending order of area size.
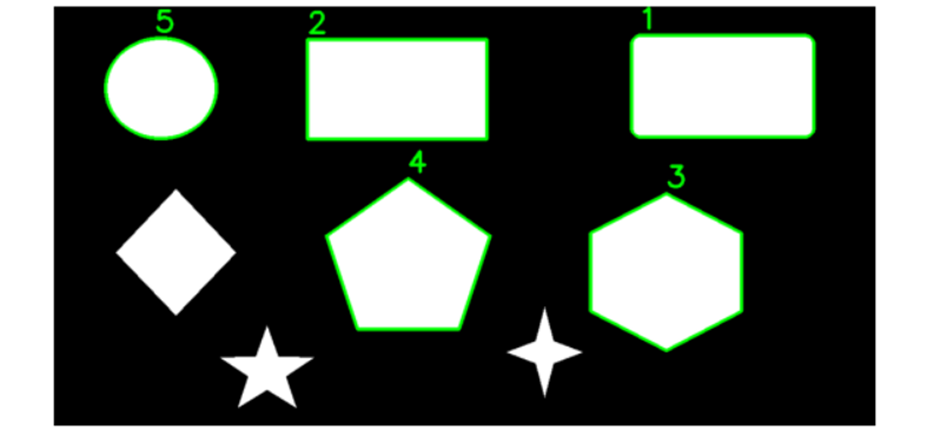
Drawing a rectangle around the contour
Bounding rectangles are often used to highlight the regions of interest in the image. If this region of interest is a detected contour of a shape in the image, we can enclose it within a rectangle. There are two types of bounding rectangles that you may draw:
- Straight Bounding Rectangle
- Rotated Rectangle
For both types of bounding rectangles, their vertices are calculated using the coordinates in the contour list.
Straight Bounding Rectangle
A straight bounding rectangle is simply an upright rectangle that does not take into account the rotation of the object. Its vertices can be calculated using the cv2.boundingRect() function which calculates the vertices for the minimal up-right rectangle possible using the extreme coordinates in the contour list. The coordinates can then be drawn as rectangle using cv2.rectangle() function.
Function Syntax:
x, y, w, h = cv2.boundingRect(array)
Parameters:
array – It is the Input gray-scale image or 2D point set from which the bounding rectangle is to be created
Returns:
- x – It is X-coordinate of the top-left corner
- y – It is Y-coordinate of the top-left corner
- w – It is the width of the rectangle
- h – It is the height of the rectangle
Image Moments
Image moments are like the weighted average of the pixel intensities in the image, they help you to calculate some features like the center of mass of the object, area of the object, etc. We can get the image moment of this contour by using the function cv2.moments() which gives us a dictionary of various properties to use.
Function Syntax:
retval = cv.moments(array)
Parameters:
array – Single-channel, 8-bit or floating-point 2D array
Returns:
retval – A python dictionary containing different moments properties
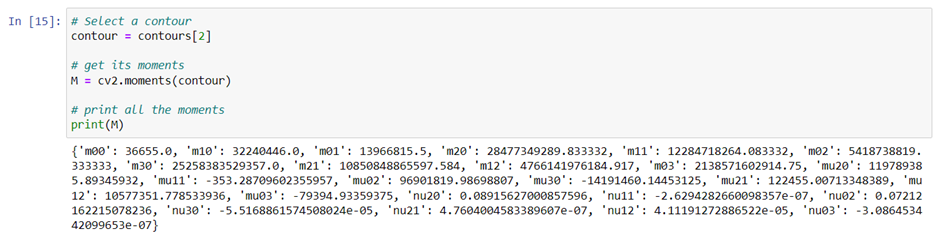
The values returned represent different kinds of image movements including raw moments, central moments, scale/rotation invariant moments, and so on. For more information on image moments and how they are calculated you can read this Wikipedia article. Below we will discuss how some of the image moments returned can be used to analyze the contours detected.
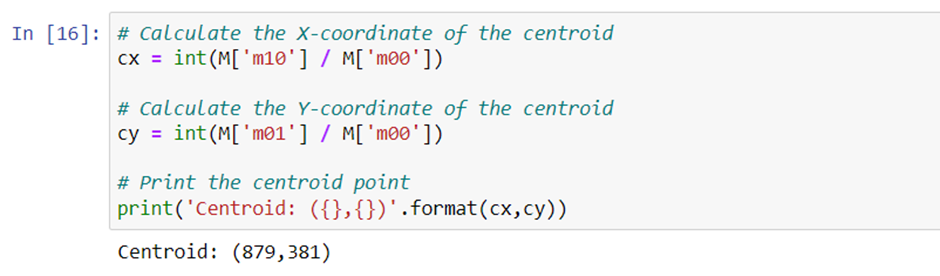
Find the center of a contour
The image moments calculated above can be used to find the centroid of the object in the image. The coordinate of the Centroid is given by two relations the central image moments, Cx=M10/M00 and Cy=M01/M00.
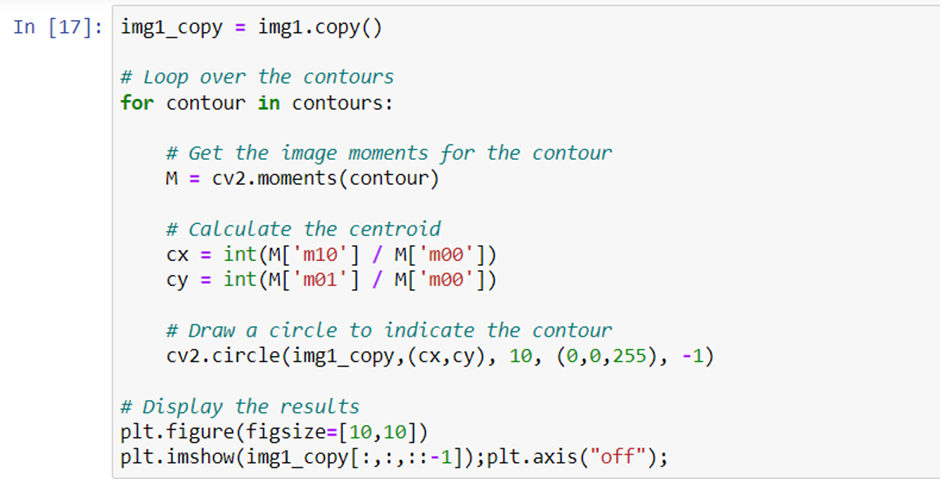
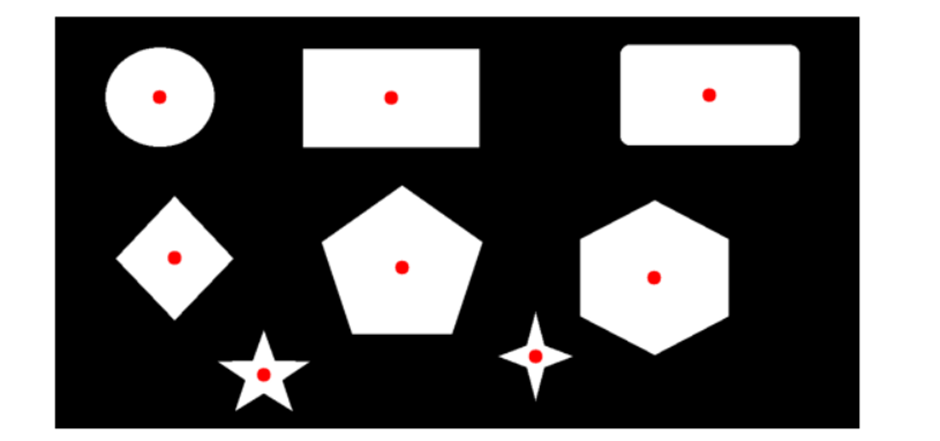
Now we can repeat the process for the rest of the contours detected in the image and draw a circle using cv2.circle() to indicate the centroids on the image.
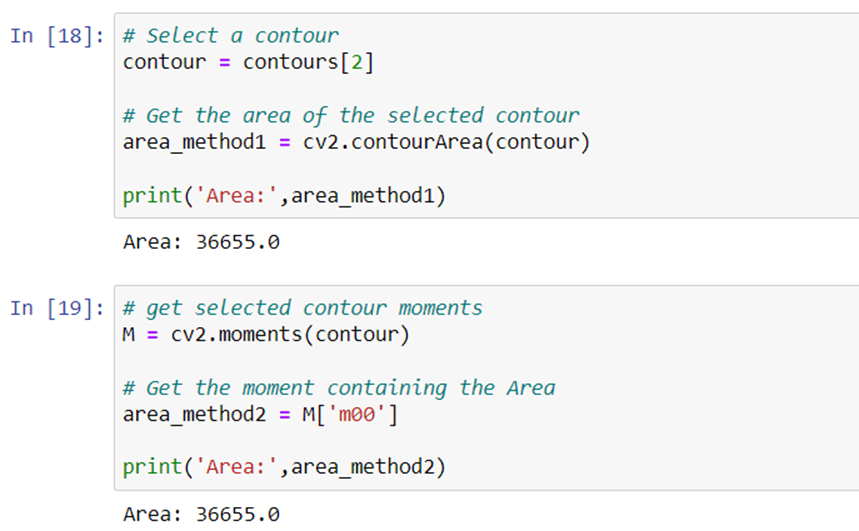
Finding Contour Area
Area for a contour can be found using two methods. One is using the function cv.contourArea() as we have done before for sorting and retrieving the largest contour.
Another method is to get the ‘m00’ moment which contains the area of the contour.
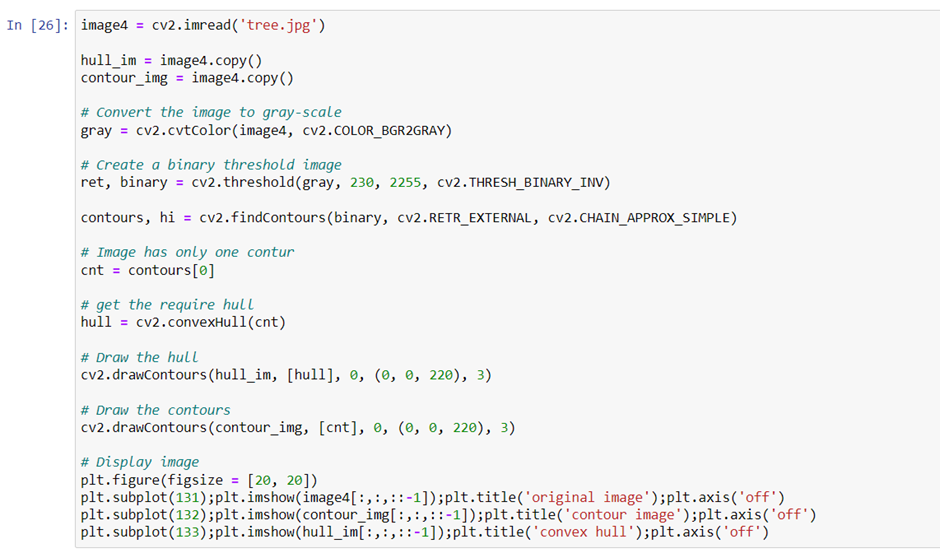
Drawing Convex Hull
Convex Hull is another way to draw the contour onto the image. The function cv2.convexHull() checks a curve for convexity defects and corrects it. Convex curves are curves which are bulged out. And if it is bulged inside (Concave), it is called defects.
Function Syntax:
hull = cv2.convexHull(points, hull, clockwise, returnPoints)
Parameters:
- points – Input 2D point set. This is a single contour.
- clockwise – Orientation flag. If it is true, the output convex hull is oriented clockwise. Otherwise, it is oriented counter-clockwise. The assumed coordinate system has its X axis pointing to the right, and its Y axis pointing upwards.
- returnPoints – Operation flag. In case of a matrix, when the flag is true, the function returns convex hull points. Otherwise, it returns indices of the convex hull points. By default it is True.
Returns:
- hull – Output convex hull. It is either an integer vector of indices or vector of points. In the first case, the hull elements are 0-based indices of the convex hull points in the original array (since the set of convex hull points is a subset of the original point set). In the second case, hull elements are the convex hull points themselves.