Histogram Equalizer is a computer vision technique that adjusts the luminosity levels of an image to make it more visually appealing.
Histogram equalization is a process that lets us take an image and adjust the brightness levels so that each pixel in the image has a similar level of illumination. It does this by mapping pixels to a new set of values, where each value represents the number of pixels at that particular brightness level. Let’s imagine that we have an image with a pixel brightness range from 100 to 500. If we equalized this image, each pixel would be mapped to a value that represented the number of pixels in the image at that particular brightness level. Let’s say that each new value was 20. Now, one area of the image would have 50 values (50 pixels in the range or 20 times 100). Another area of the image would have 10 values (10 pixels in the range or 20 times 10). The end result is that different areas of your image will have different brightness levels.
This technique is commonly used for enhancing or restoring old photographs or images with faded colors.
- What is Histogram?
A histogram is a graphical representation of the frequency distribution of data. It is usually visualized as a bar plot with heights corresponding to the frequency in each interval and widths corresponding to the size of each class interval. Suppose we live in a land where there are only 5 colors. To get the histogram, count how many pixels for each color. in the image. The distribution for this image is as follows:
- black — 34 pixels
- gray — 12 pixels
- white — 646 pixels
- yellow — 76 pixels
- blue — 46 pixels
Bins refer to each possible value in a set, so for an image there would be five bins. Imagine that the color histogram of an image is divided into five equal-sized intervals; one representing blue, two representing green and three representing red. The frequency distribution is shown in the bar plot below. The horizontal axis are the bins and the vertical one shows the frequencies. With histogram equalization, we will be interested in the intensity histogram of each image. Essentially, we count the number of pixels corresponding to a particular pixel intensity value, 0 to 255.
- Histograms of low contrast images
For each image, the histogram and cumulative histogram are shown. At first glance, you can see that the contrast difference is only slight. The cumulative histogram is simply a running total of the frequency coming in from the first histogram to last one. It’s scaled down so that it fits on the same graph as (histograms).
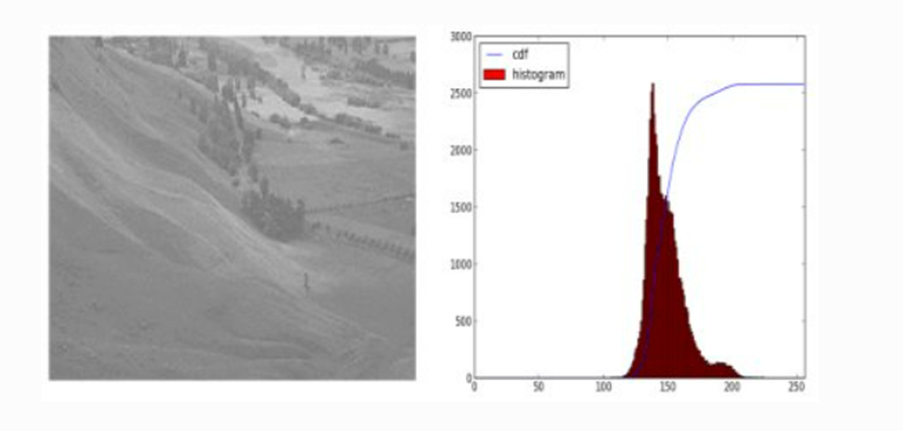
- Image looks too bright
The image below looks vibrant yet not overwhelmingly bright. The explanation can be found in the histogram. The pixel intensities are concentrated in the upper region of the range, ranging between 125 and 200. In this region, the pixels are a light shade, which is why we can see a less saturated look. There is a limited range of shades with pixels near the middle looking very similar and this makes the image look faded or pixelated. But look at what happens when we zoom in on a small region – the histogram graph is ascending at a steep slope here, meaning there are more pixels for that specific intensity value.
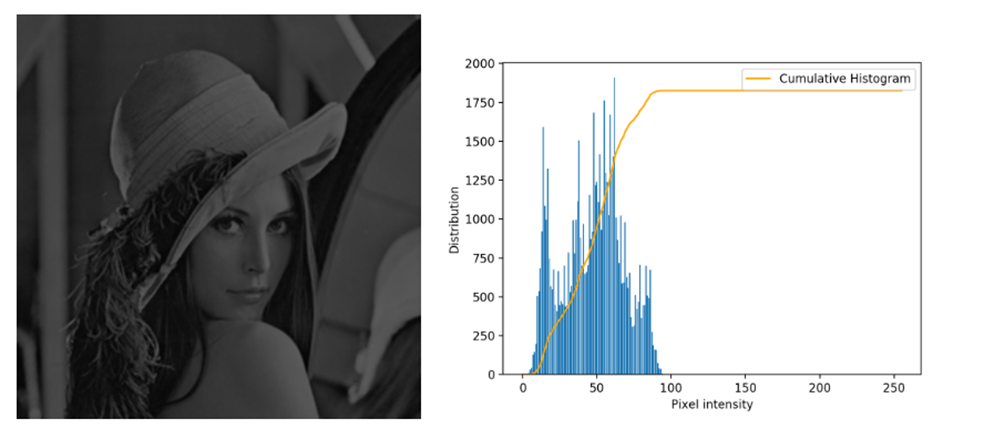
- Image looks to dark
The image below looks rather dark and gloomy. To clarify, the higher intensities are placed in the upper region of the histogram, between 95 and 5. As you can see in this region, the color of pixels is darker in shades. You can also see that the histogram is increasing sharply in this region while it stays flat elsewhere. The histogram in the previous image has a strong spike near the middle, indicating that there is a lot of dark and very dark colors in this image. The upper intensities are in the region between 95 and 5, which means that these colors are either black or very dark shades of grey.
Histogram analysis of low contrast images in both cases indicated that pixels have low contrast resulting in similar shades with a faded appearance.
the cumulative histogram increases until it hits a point then stays flat as the rightmost part of the region.
The contrast of images is improved when left- and right-hand colors are made more distinct. We can do this by darkening the individual colors that make up a photograph on either side. It can seem like a complicated process, but it’s actually quite similar to changing the intensity of pixels. In order to have a good contrast on your image, the following histogram characteristics are desirable:
- The pixel intensities are randomly distributed across a specific range of values, where each value is equally probable.
- The graph of the cumulative histogram is increasing linearly across the full intensity range.
Histogram equalization mathematically modifies the distribution of light intensity values in an image to achieve contrast. enhancement for improved visibility of details in a dark image. Histogram equalization can be used to increase the apparent contrast of an image, which is useful for highlights and shadows in digital photography. The histogram of the original image has “uniform” distribution where there is no differentiation between light or dark areas of the image.
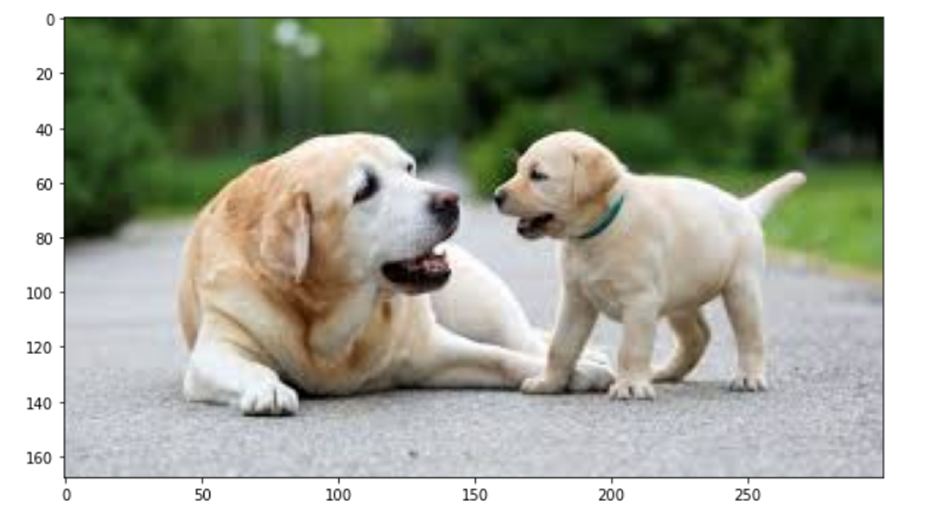
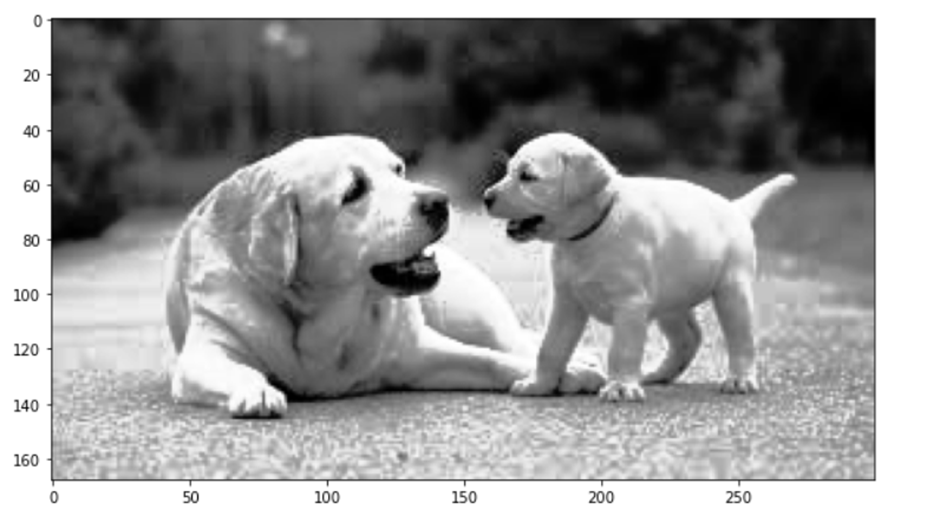
Python Implementation
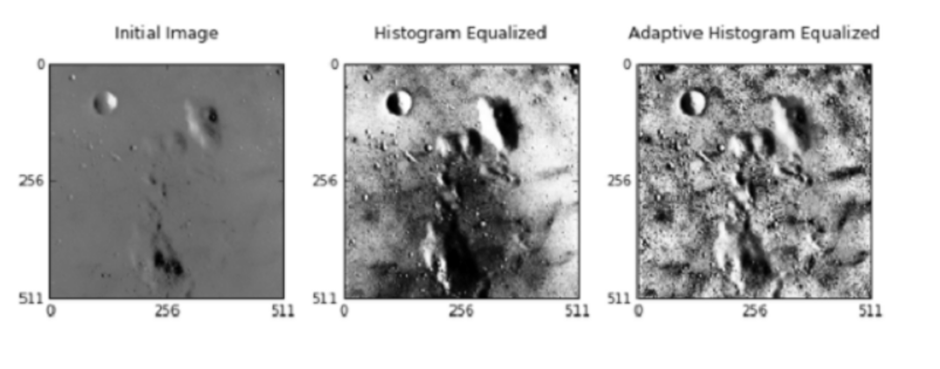
Adaptive Histogram Equalization
Adaptive histogram equalization is a form of image enhancement that differs from ordinary histogram equalization. The adaptive method computes several histograms, each corresponding to a section of the image. and uses them to redistribute the lightness values of the image.
It is therefore suitable for improving the contrast, making images look sharper, and emphasizing lines. and edges. An adaptive histogram equalizer would provide separate histograms for different regions of the image, with a value corresponding to the distribution of intensity values in that region. Then it would compute a new histogram based on these smaller distributions and compare it to one of the original histograms. If they are close, then there is not much change and no further adaptation is necessary.
If the new histogram is significantly skewed, then it would change the weights of the corresponding edge pixels and re-compute the histogram for that region. This process could be repeated until a desired level of accuracy was achieved.