Histogram equalization is a technique used to enhance the quality and contrast of an image. It is a process of adjusting the intensity values of an image to improve its visual appearance. In this article, we will discuss the concept of histogram equalization, and its benefits, also we will be looking at the implementation in Python language.
What is Histogram Equalization?
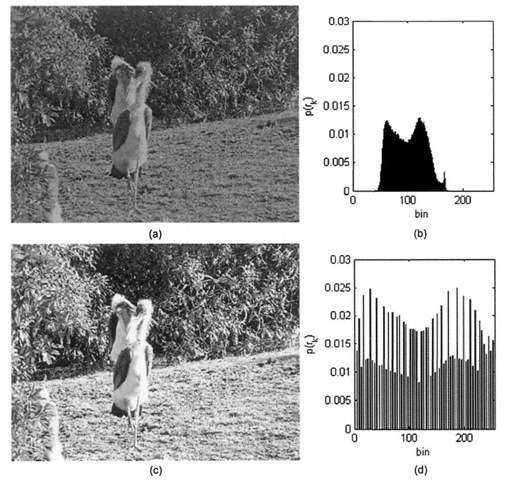
Histogram equalization is an image processing technique aimed at enhancing the quality and contrast of an image. It achieves this by effectively spreading out the most frequent intensity values, i.e., stretching out the intensity range of the image. The intensity values of an image are represented by a histogram, which is a graph that shows the frequency of each intensity value in the image.
The process of histogram equalization involves the following steps:
1 – Calculate the histogram of the image.
2 – Calculate the cumulative distribution function (CDF) of the histogram.
3 – Normalize the CDF to obtain the transformation function.
4 – Apply the transformation function to the image.
The transformation function that I have mentioned in Step 3 is used to map the intensity values of the image to a new range of values. This results in an image with improved contrast and visual appearance.
Advantages of Histogram Equalization
Histogram equalization has several advantages, a few of them are:
Improved contrast: Histogram equalization can enhance the contrast of an image by redistributing the intensity values of the image.
Improved visual appearance: Histogram equalization can improve the visual appearance of an image by making it more visually appealing.
Easy to implement: Histogram equalization is a simple and easy-to-implement technique that can be applied to any image.
Now let’s see how we can implement Histogram Equalization using Python. We will use the OpenCV library to load and display the image.
import cv2
import numpy as np
from matplotlib import pyplot as plt

# Load the image
img = cv2.imread('darkdog.jpg', 0)

# Calculate the histogram
hist, bins = np.histogram(img.flatten(), 256, [0, 256])

# Calculate the cumulative distribution function
cdf = hist.cumsum()
cdf_normalized = cdf * hist.max() / cdf.max()

# Normalize the CDF to obtain the transformation function
cdf_m = np.ma.masked_equal(cdf, 0)
cdf_m = (cdf_m - cdf_m.min()) * 255 / (cdf_m.max() - cdf_m.min())
cdf = np.ma.filled(cdf_m, 0).astype('uint8')

# Apply the transformation function to the image
img_equalized = cdf[img]

# Display the original and equalized images
plt.figure(figsize=(12, 8))
plt.subplot(121), plt.imshow(img, cmap='gray')
plt.title('Original Image'), plt.xticks([]), plt.yticks([])
plt.subplot(122), plt.imshow(img_equalized, cmap='gray')
plt.title('Equalized Image'), plt.xticks([]), plt.yticks([])
plt.show()
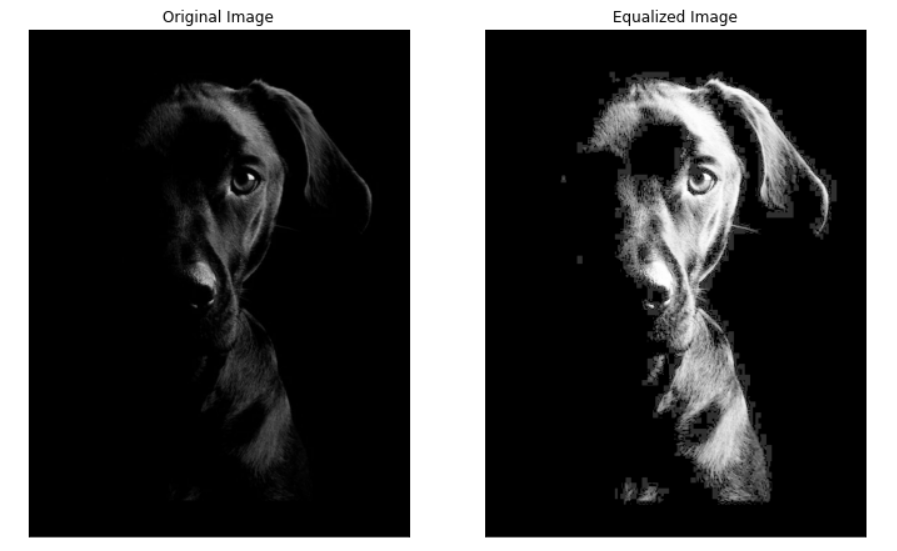
After executing this code, you will be able to see the original image and histogram equalized images side by side.
Conclusion
Histogram equalization is a powerful technique in computer vision and image processing that enhances the quality and contrast of images. By redistributing the intensity values of an image, histogram equalization improves the visual appearance and makes the details more prominent. In this article, we saw the concept of histogram equalization, its advantages, and its implementation using Python and the OpenCV library.
