Pandas is a powerful and popular library for data processing and analysis in Python. It offers a wide range of functions to help transform and reshape data according to specific needs. In this article, we’ll explore some of the most common ways to transform data in Pandas.
Creating a DataFrame
Let’s start by creating a simple DataFrame with two columns, ‘name’ and ‘age’:

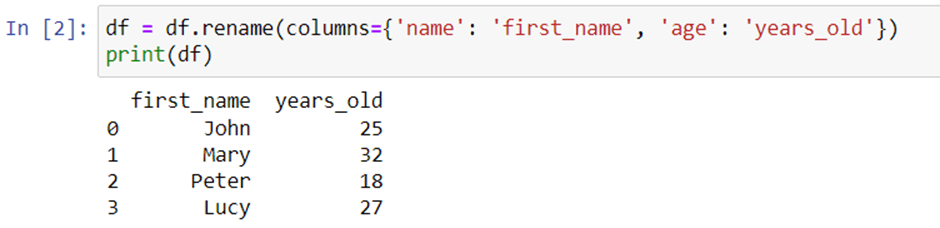
Changing Column Names
Sometimes, you might want to change the column names in your DataFrame to make them more descriptive or easier to work with. You can do this using the rename method:
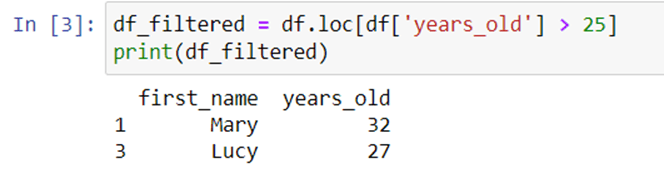
Filtering Rows
Row filtering is a common operation when working with data. You can use the loc method to select rows based on a condition. For example, to select all rows where the age is greater than 25:
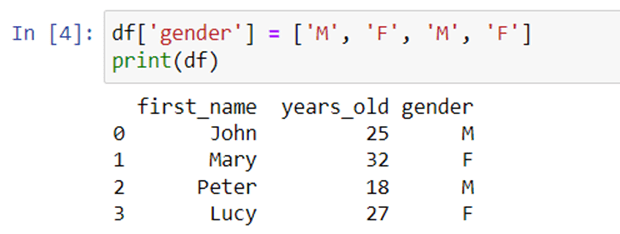
Adding Columns
You can add a new column to a DataFrame using the parenthesis. For example, to add a column ‘gender’ to the DataFrame:
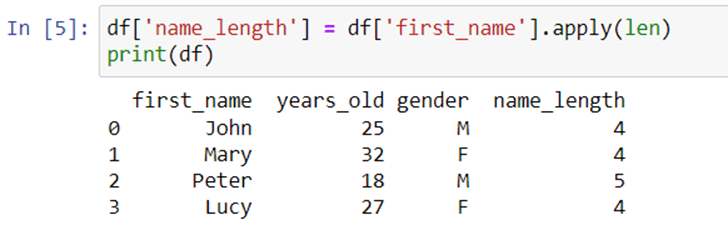
Applying Functions
You can apply a function to a DataFrame column using the apply method. For example, to apply the ‘len’ function to the ‘first_name’ column:
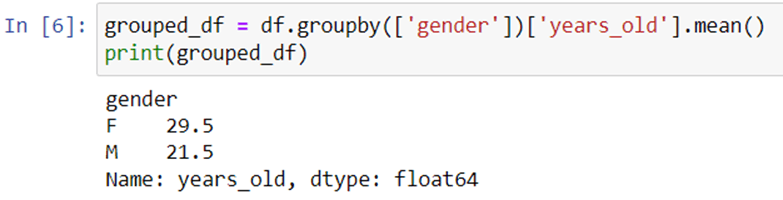
Grouping Data
Grouping data is an effective way to analyze patterns in your data. You can group data using the groupby method. For example, to group the data by gender and calculate the average age for each group:
Conclusion
In this article, we covered some of the most common ways to transform data in Pandas. We learned how to change column names, filter rows, add columns, apply functions, and group data. These are powerful tools that can help you to gain insights into your data and make better decisions.
