Pandas is a popular Python library used for data manipulation and analysis. One of the most powerful features of Pandas is its ability to create pivot tables. Pivot tables are useful for summarizing and analyzing data, allowing you to gain insights and make better decisions. In this tutorial, we will go over how to create a pivot table in Pandas.
Creating a DataFrame
To create a pivot table, we first need a dataset to work with. In this example, we will create a simple DataFrame with some dummy data:
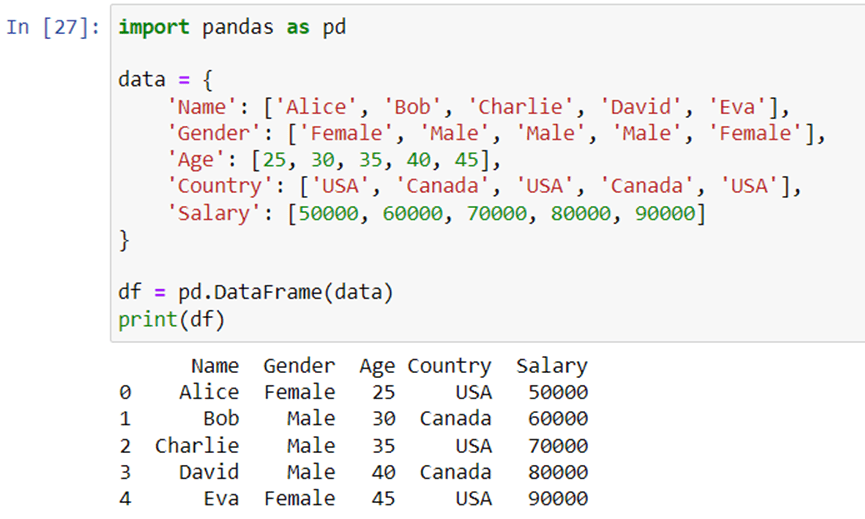
This DataFrame contains the information about five employees, including their name, gender, age, country, and salary.
Creating a Pivot Table
Now that we have our DataFrame, we can create a pivot table using the pivot_table() function in Pandas. The pivot_table() function takes few parameters:
data: The DataFrame to use for the pivot table.
index: The column or columns to use as the index of the pivot table.
columns: The column or columns to use as the columns of the pivot table.
values: The column or columns to use as the values of the pivot table.
aggfunc: The aggregation function to use when multiple values are found for a single combination of the index and columns.
Let’s create a pivot table which shows the average salary for each gender and country:
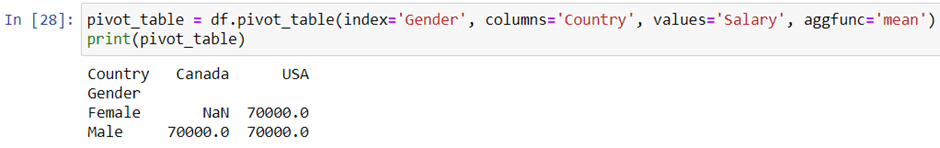
This pivot table shows the average salary for each gender and country. We can see that the average salary for females in the USA is 70,000, while the average salary for males in Canada is 70,000.
Customizing the Pivot Table
We can customize the pivot table by adding more columns to the index or columns, or by using different aggregation functions. For example, let’s create a pivot table that shows the sum of salaries for each age group, broken down by gender and country:
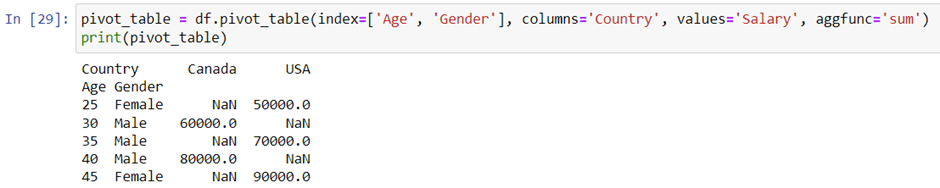
This pivot table shows the sum of salaries for each age group, broken down by gender and country. We can see that there are no female employees in Canada and no male employees in the USA aged 25.
Conclusion
pivot tables are an incredibly powerful tool in data analysis and Pandas makes it easy to create them. By using the pivot_table() method, you can quickly transform your data into a more meaningful and understandable format. With Pandas, you have complete control over how your data is aggregated and displayed, allowing you to gain valuable insights into your data.
In this blog, we covered the basics of pivot tables, including how to create a pivot table, how to specify the index, columns, and values, and how to apply different aggregation functions. We also covered more advanced topics, such as multi-level pivot tables and working with missing data.
