Pandas is a powerful Python library that provides rich data analysis capabilities. One of its key strengths is its ability to handle time series data. Time series data is a collection of data points that are recorded over time, such as stock prices or weather data. In this guide, we will explore how to use Pandas for time series data analysis, and provide code examples to help you get started.
1 – Importing Time Series Data into Pandas
The first step in working with time series data is to import it into Pandas. We will explore the different ways of importing data and reading from CSV files.
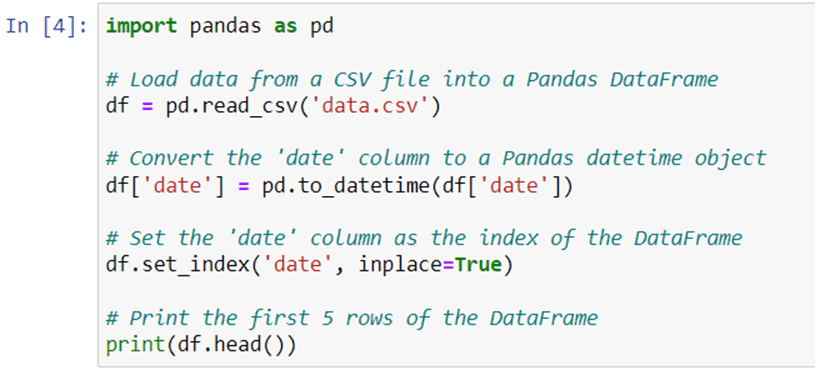
In this example, firstly we imported the Pandas library and then load the time series data from a CSV file into a Pandas DataFrame using the read_csv function.
Next, we convert the ‘date’ column to a Pandas datetime object using the to_datetime function, which allows us to easily manipulate and analyze the time series data.
Then, we set the ‘date’ column as the index of the DataFrame using the set_index function. This allows us to easily perform time-based operations such as resampling, aggregation, and plotting.
Finally, we printed top 5 rows of our DataFrame using the head function to ensure that the data was loaded correctly.
2 – Creating and Manipulating Time Series Data with Pandas
Once the data is imported into Pandas, we can start manipulating it. We will explore how to create time series objects, resample data at different frequencies, and apply rolling statistics.

As you can see in this example, we start by creating a Pandas DataFrame with a DatetimeIndex using the date_range function to generate daily dates for the year 2022.
Next, we add two columns to the DataFrame – ‘temperature’ and ‘humidity’ – and populate them with sample data.
We then use the resample function to resample the data to a weekly frequency and calculate the mean of each week. This allows us to easily perform time-based aggregations on the data.
We also use the rolling function to calculate the rolling average of the temperature column over a window of 7 days. This allows us to analyze trends in the data over time.
Finally, we use the plot function to create a line plot of the temperature and humidity data over the entire year. This allows us to visualize how the temperature and humidity change over time.
3 – Working with Missing Data
Time series data often has missing values, which can affect analysis and visualization. We will explore different techniques for handling missing data, including filling in missing values and interpolating data.
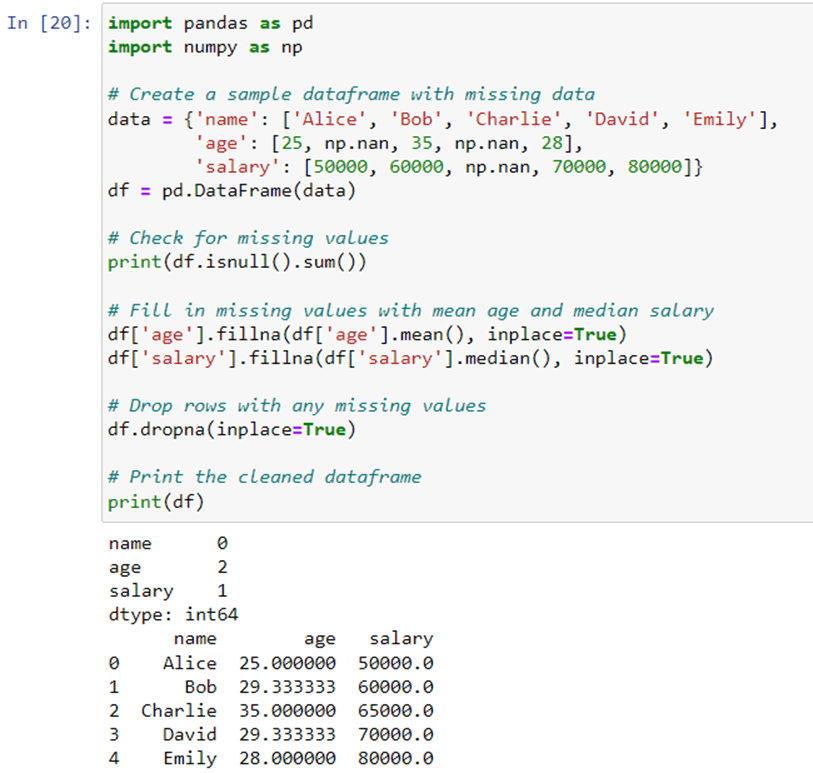
In this example, we create a sample dataframe with missing data in the “age” and “salary” columns. We use the isnull() method to check for missing values, and then fill in the missing values in the “age” column with the mean age and in the “salary” column with the median salary. Finally, we drop any rows that still have missing values using the dropna() method, and print the cleaned dataframe.
4- Time-Based Indexing and Slicing
Pandas provides powerful time-based indexing and slicing capabilities, allowing us to extract data for specific time periods.
5 – Time Series Visualization
Visualizing time series data is an important step in understanding trends and patterns. You can try and explore different visualization techniques, including line plots, bar plots, and heatmaps.
Conclusion
Pandas provides a wide range of techniques for working with time series data. By importing data, creating and manipulating time series objects, indexing and slicing data, visualizing data, and handling missing data, we can gain insights and make predictions based on time-based data. With the help of this comprehensive guide and code examples, you can begin working with time series data in Pandas and take your data analysis to the next level.
