A Gaussian mixture is a statistical model that assumes all the data points are generated from a linear combination of multivariate Gaussian distributions. This assumption has unknown parameters that can be estimated from the data, which we refer to as hyperparameters. Firstly, K-means employs the Gaussian distributions and centers of latent Gaussians. However, unlike K-means, the covariance structure of the distributions are also taken into account. The algorithm uses the EM algorithm to iteratively find the distribution parameters that maximize a model quality measure called log-likelihood. The key steps performed in this model are:
- Initialize ~~{k y} gaussian distributions
- Equally weight each point and find probability of that the point is associated with distribution
- Please recalculate the distribution parameters based on the probability associated with each point.
- Repeat process until the log-likelihood is maximized.
There are 4 options for calculating covariances in GMM:
- Full: “Each distribution has its own general covariance matrix” is true for
- Tied: All distributions share a general covariance matrix.
- Diag: Generally speaking, each distribution has its own covariance matrix.
- Spherical: Every distribution has its own individual variance
We have to make decisions about the covariance type, as well as the number of clusters in a model. BIC score, Silhouette score, Calinski Harabasz score and Davies Bouldin are used for selecting both parameters with grid search.
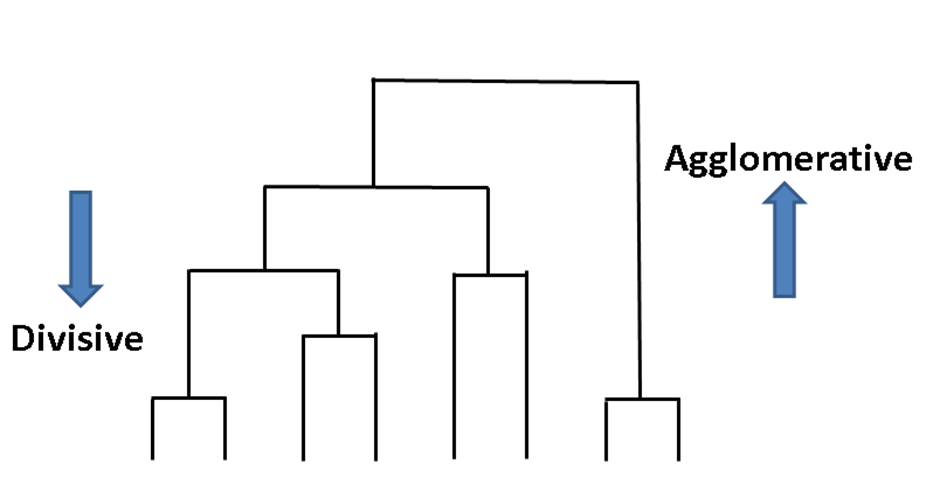
Agglomerative clustering is a family of clustering algorithms that builds nested clusters successively. This hierarchy of clusters can be represented as a tree diagram known as a dendrogram. The top of the tree contains all data points while the bottom gives you individual points. You can link data points together in a successive manner with:
- Single linkage: The distance between the two clusters is minimized by centering the covariance matrix in these observations. around the central value for each cluster. A final multivariate distance matrix is then calculated between these two sets of clusters.
- Complete or Maximum linkage: Uses the same measure of cluster compactness as the Fowlkes-Mallows criterion, but with absolute maximum distance instead of the sum of squared distance Closeness is the minimum number of clusters that can be placed next to a single point without crossing clusters.
- Average linkage: (Method) The distance between each observation and the average of clusters is minimized.
- Ward: For our exercise, we will be using hierarchical clustering which is an extension of the k-means algorithm. Minimizing the sum of squared differences between all clusters is conceptually similar but this software requires you to specify levels.