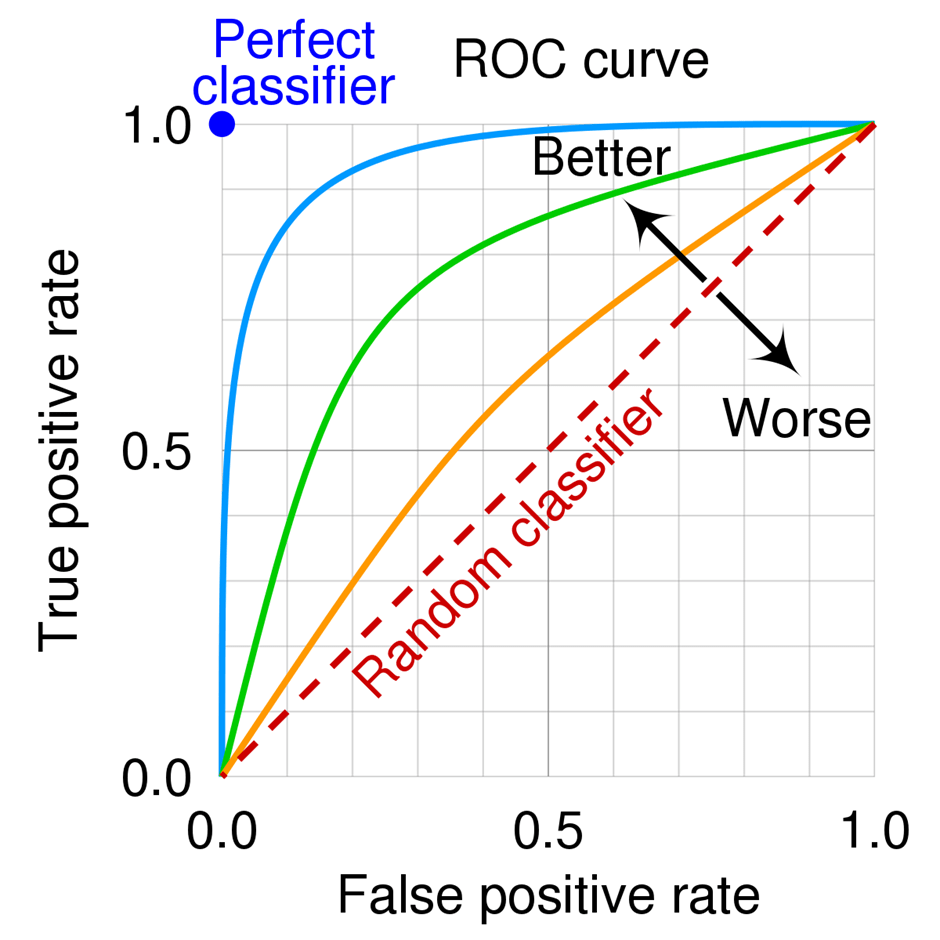
The ROC curve is a graph between False positive rate on the x axis and True positive rate on the y axis. True positive rate is the ratio of True positives to the total number of positive samples. False positive rate is the ratio of False positives to the total number of negative samples.
The FRP and TPR are plotted on several threshold values to construct the ROC curve. The area under the ROC curve ranges from 0 to 1. A completely random model has an ROC of 0.5, which is represented by a straight line. The more the ROC curve deviates from the straight line, the better the model is. ROC curves are used for binary classification. The below image shows an example of an ROC curve.
TPR = TP / TP + FN
FPR = FP / TP + FP
Popular Posts
Author

Spread the knowledge