ROC curve

What is the ROC curve?
The ROC curve is a graph between False positive rate on the x axis and True positive rate on the...
Read More →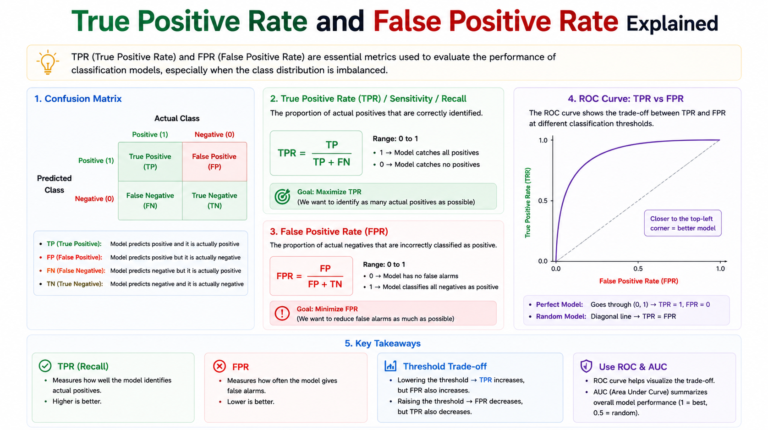
True Positive Rate and False Positive Rate Explained
If you’ve ever looked at an ROC curve and wondered what those two axes actually mean, you’re looking at true...
Read More →