
What is a confusion matrix?
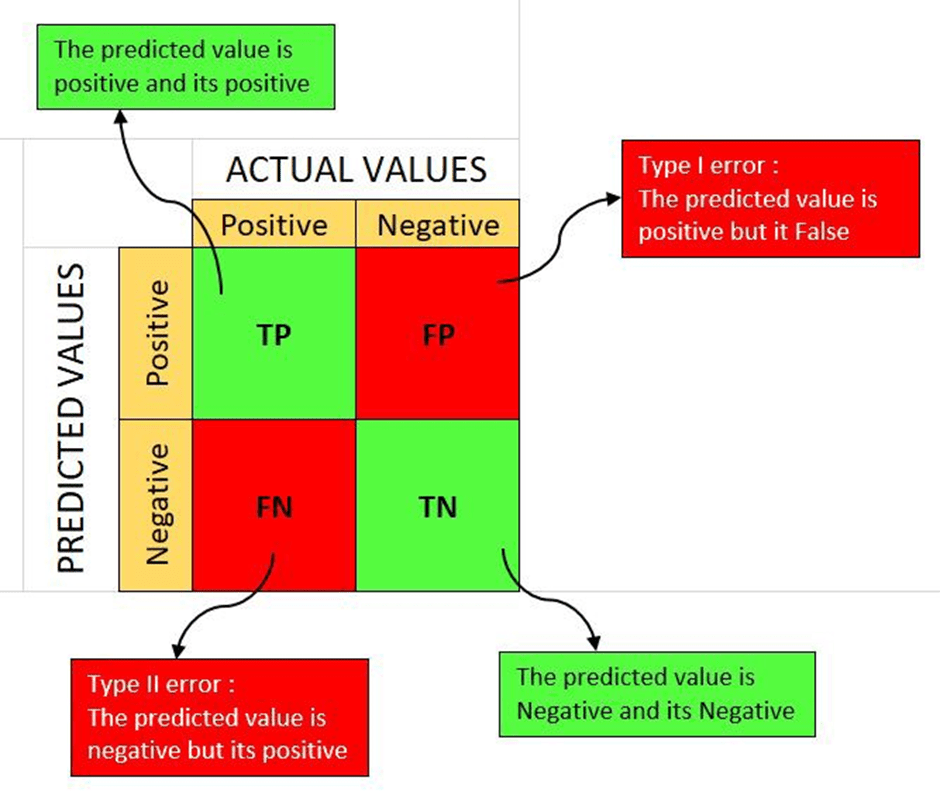
The confusion matrix is a 2×2 table that contains 4 outputs provided by the binary classifier. Various measures, such as error-rate, accuracy, specificity, sensitivity, precision and recall are derived from it. Confusion matrix.
A dataset used for performance evaluation is called a test data set. It should contains the correct labels and predicted labels.
The predicted labels will exactly the same if the performance of a binary classifier is perfect.
The predicted labels usually match with part of the observed labels in real-world scenarios.
A binary classifier predicts all the data instances of a test data set as either positive or negative. This produces for outcomes-
- True positive (TP) – Correct positive prediction
- positive (FP) – Incorrect positive prediction
- True negative (TN) – Correct negative prediction
- False negative (FN) – Incorrect negative prediction
Basic measures derived from the confusion matrix-
- Error Rate – (FP + FN) / (P + N)
- Accuracy – (TP + TN) / (P + N)
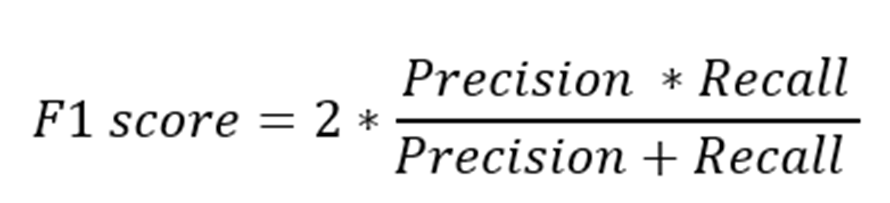
- Sensitivity (Recall or True positive rate) – TP / P
- Specificity (True negative rate) – TN / N
- Precision (Positive predicted value) – TP / (TP + FP).
Popular Posts
Author

Spread the knowledge